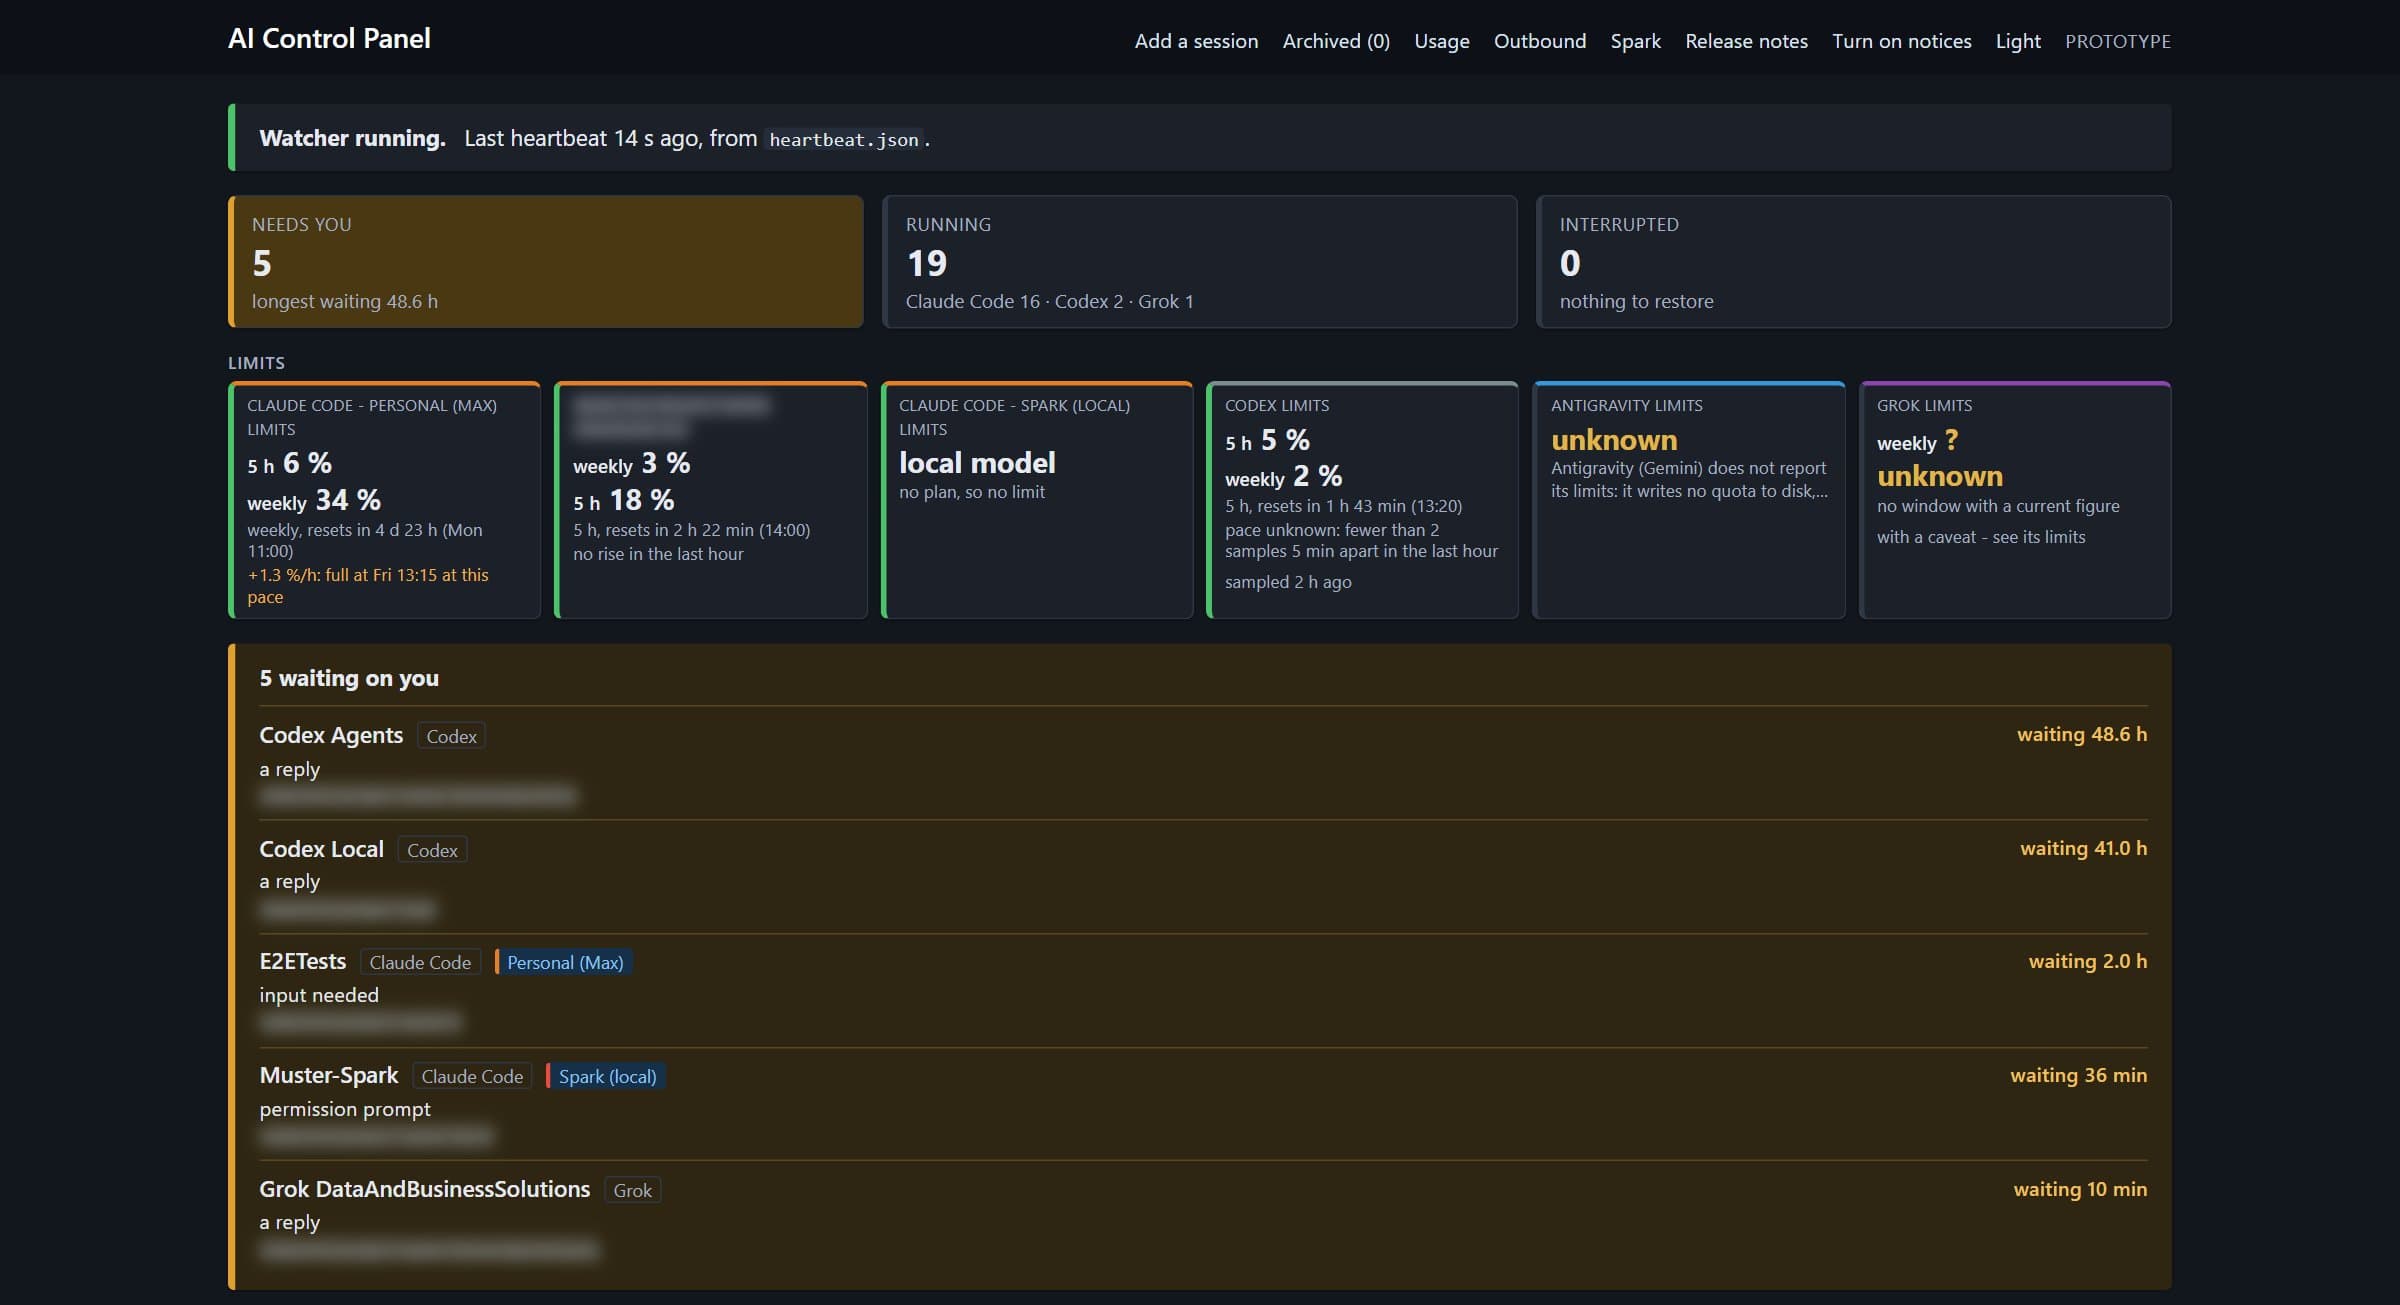
The AI Control Panel is the thing I open first every morning, and it does not spend a single token to run.
It is a web page on my own machine. It reads the files my AI tools already write about themselves and shows me what is open, what is waiting on me, what it cost, what it sent off the machine, and how the DGX Spark under my desk is doing. It launches sessions too. Claude Code on my own plan, Claude Code on a second account, Codex, Grok, or Claude Code pointed at a model running on the Spark through Ollama or vLLM.
I have written about two pieces of it before: what left the machine and watching usage like a gas gauge. This is the whole thing, as it runs today, because most of what is new is about local models.
Why it costs nothing to run
The panel never calls a model. I had the source checked for it: no call to Anthropic, OpenAI or anyone else, anywhere in the panel, the usage engine or the scripts.
Everything it shows comes from files. Claude Code writes a file per session and a transcript per conversation. Codex writes its rollouts. Grok and Antigravity write their own session records. A small watcher runs at logon and writes down what is open every 30 seconds. The usage figures come from a Python engine that reads the transcripts when I click Refresh, and it uses nothing outside the standard library.
So the panel is a reader. The sessions it launches spend tokens, because that is my CLI doing work on my account. The panel watching them does not.
It also listens on loopback only. It answers on 127.0.0.1 and nothing else on the network can reach it, there is no login because there is nothing outside the machine to log in from, and a form post that did not come from the panel itself gets refused.
The home page
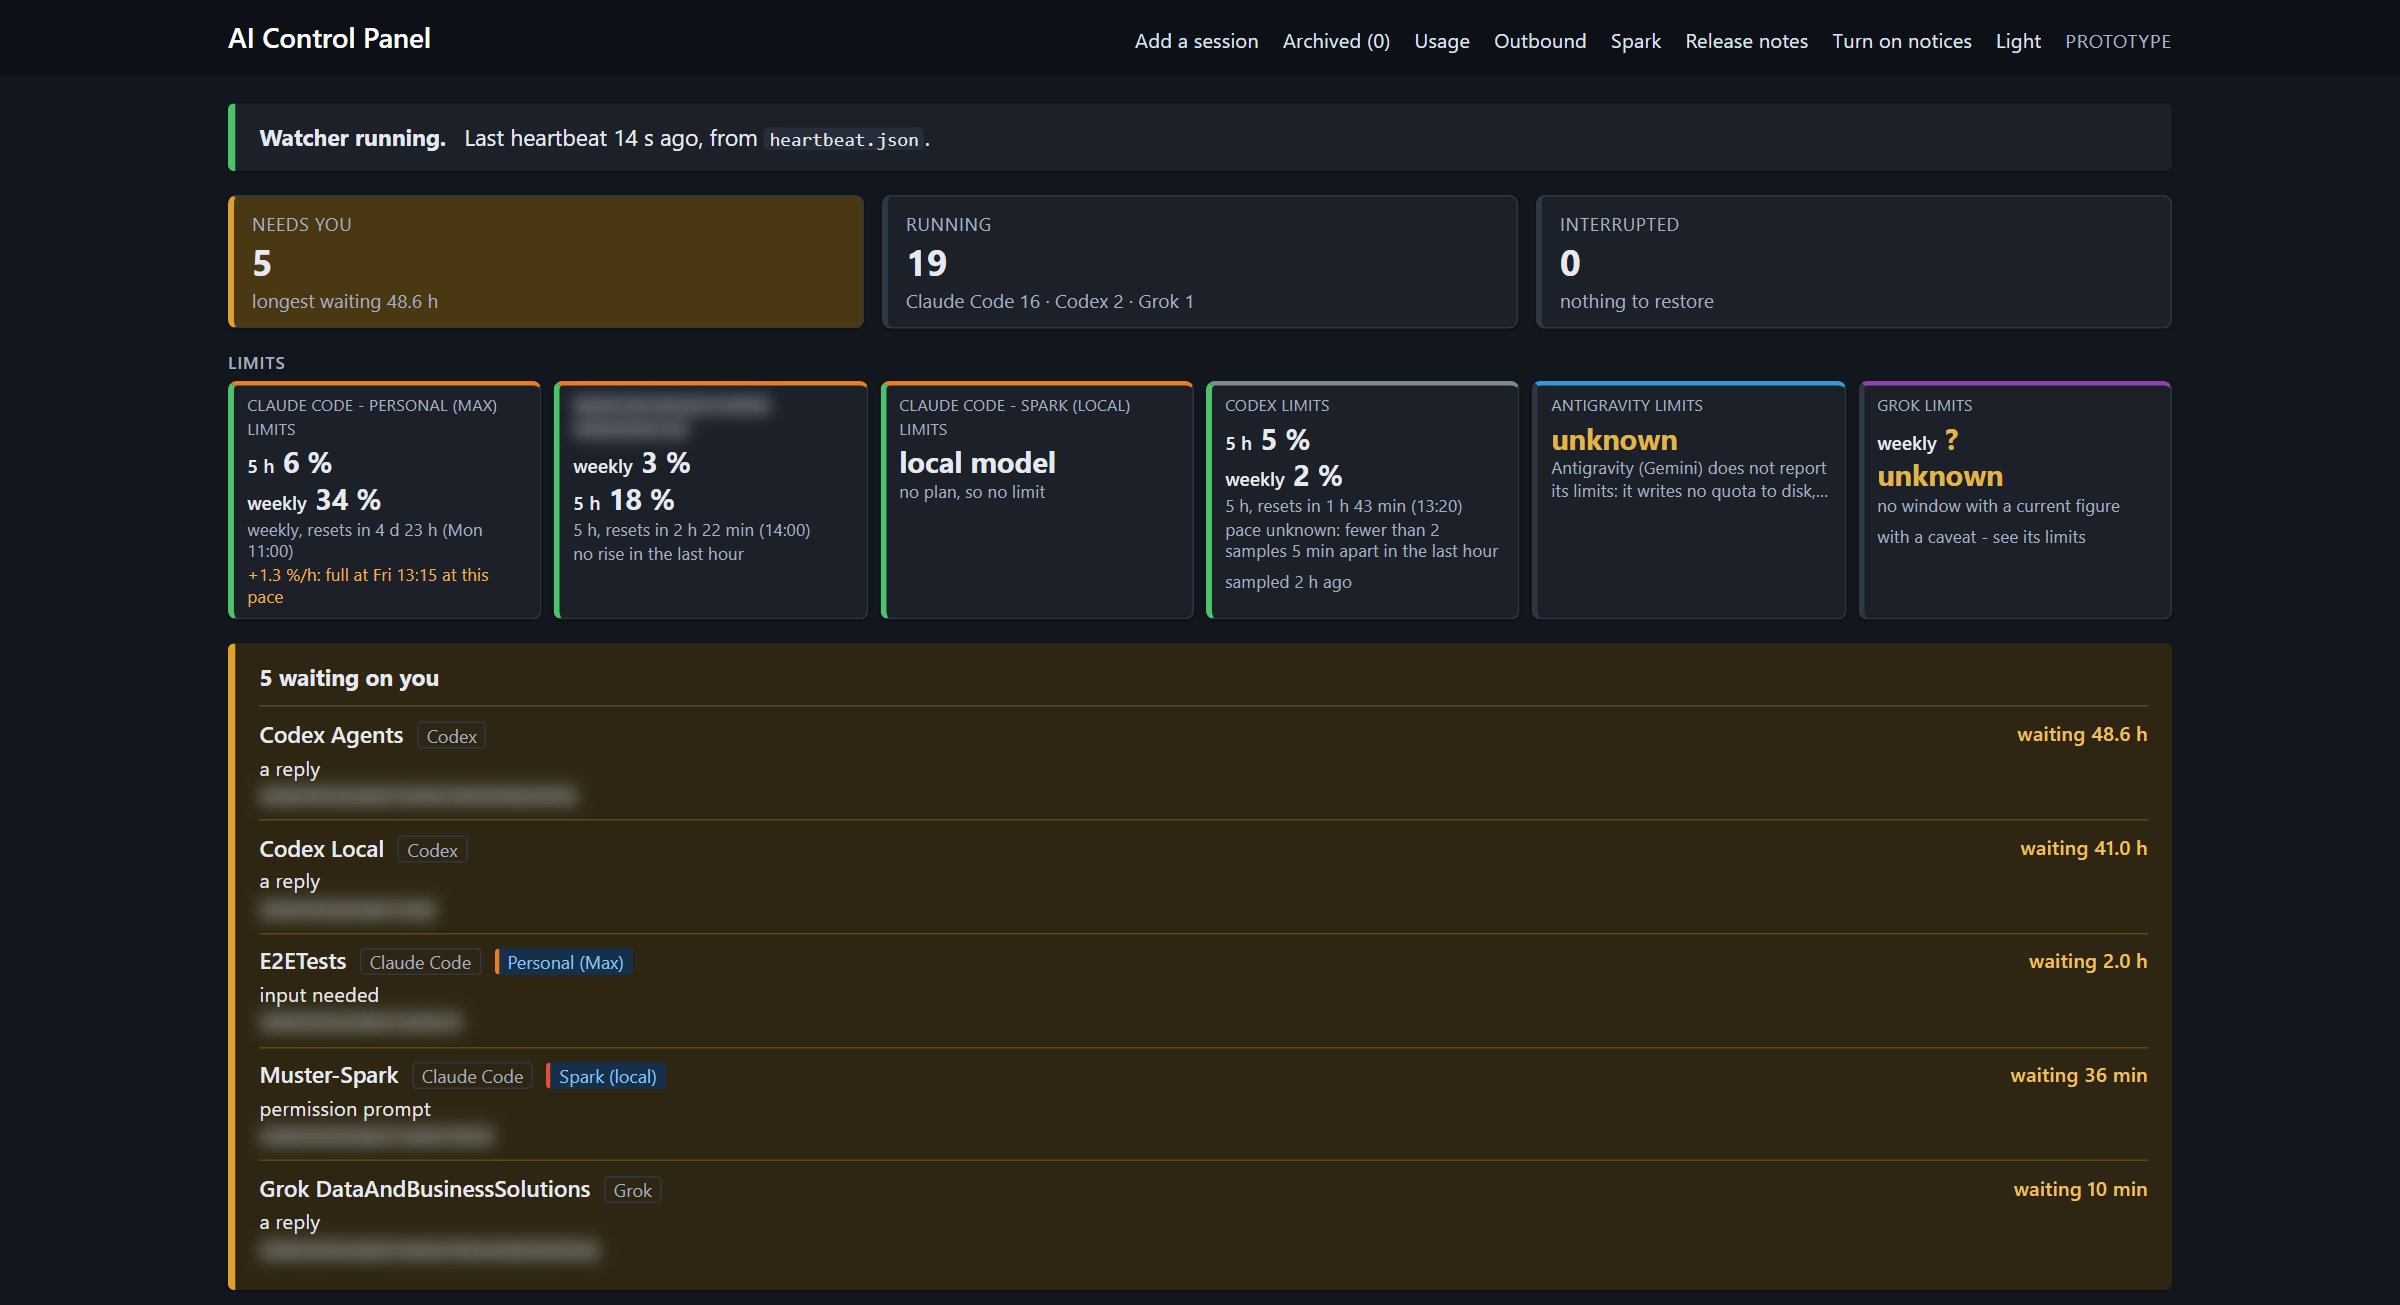
Top row is the question I actually have when I sit down. What needs me, what is running, and did anything get interrupted.
The limits row is one tile per account. My personal Max plan, a second Claude account, Codex and Grok each show their 5 hour and weekly windows as the CLI itself recorded them. Antigravity says unknown because it writes no quota to disk and the panel will not guess. The third tile is the one I like best: Claude Code on the Spark reads "local model, no plan, so no limit."
It still says PROTOTYPE in the corner. That is the build I run every day, and it will keep saying that until I am done changing it every week.
Below that is every open session, what CLI it is in, how long it has been busy or idle, and which account or machine it runs on.
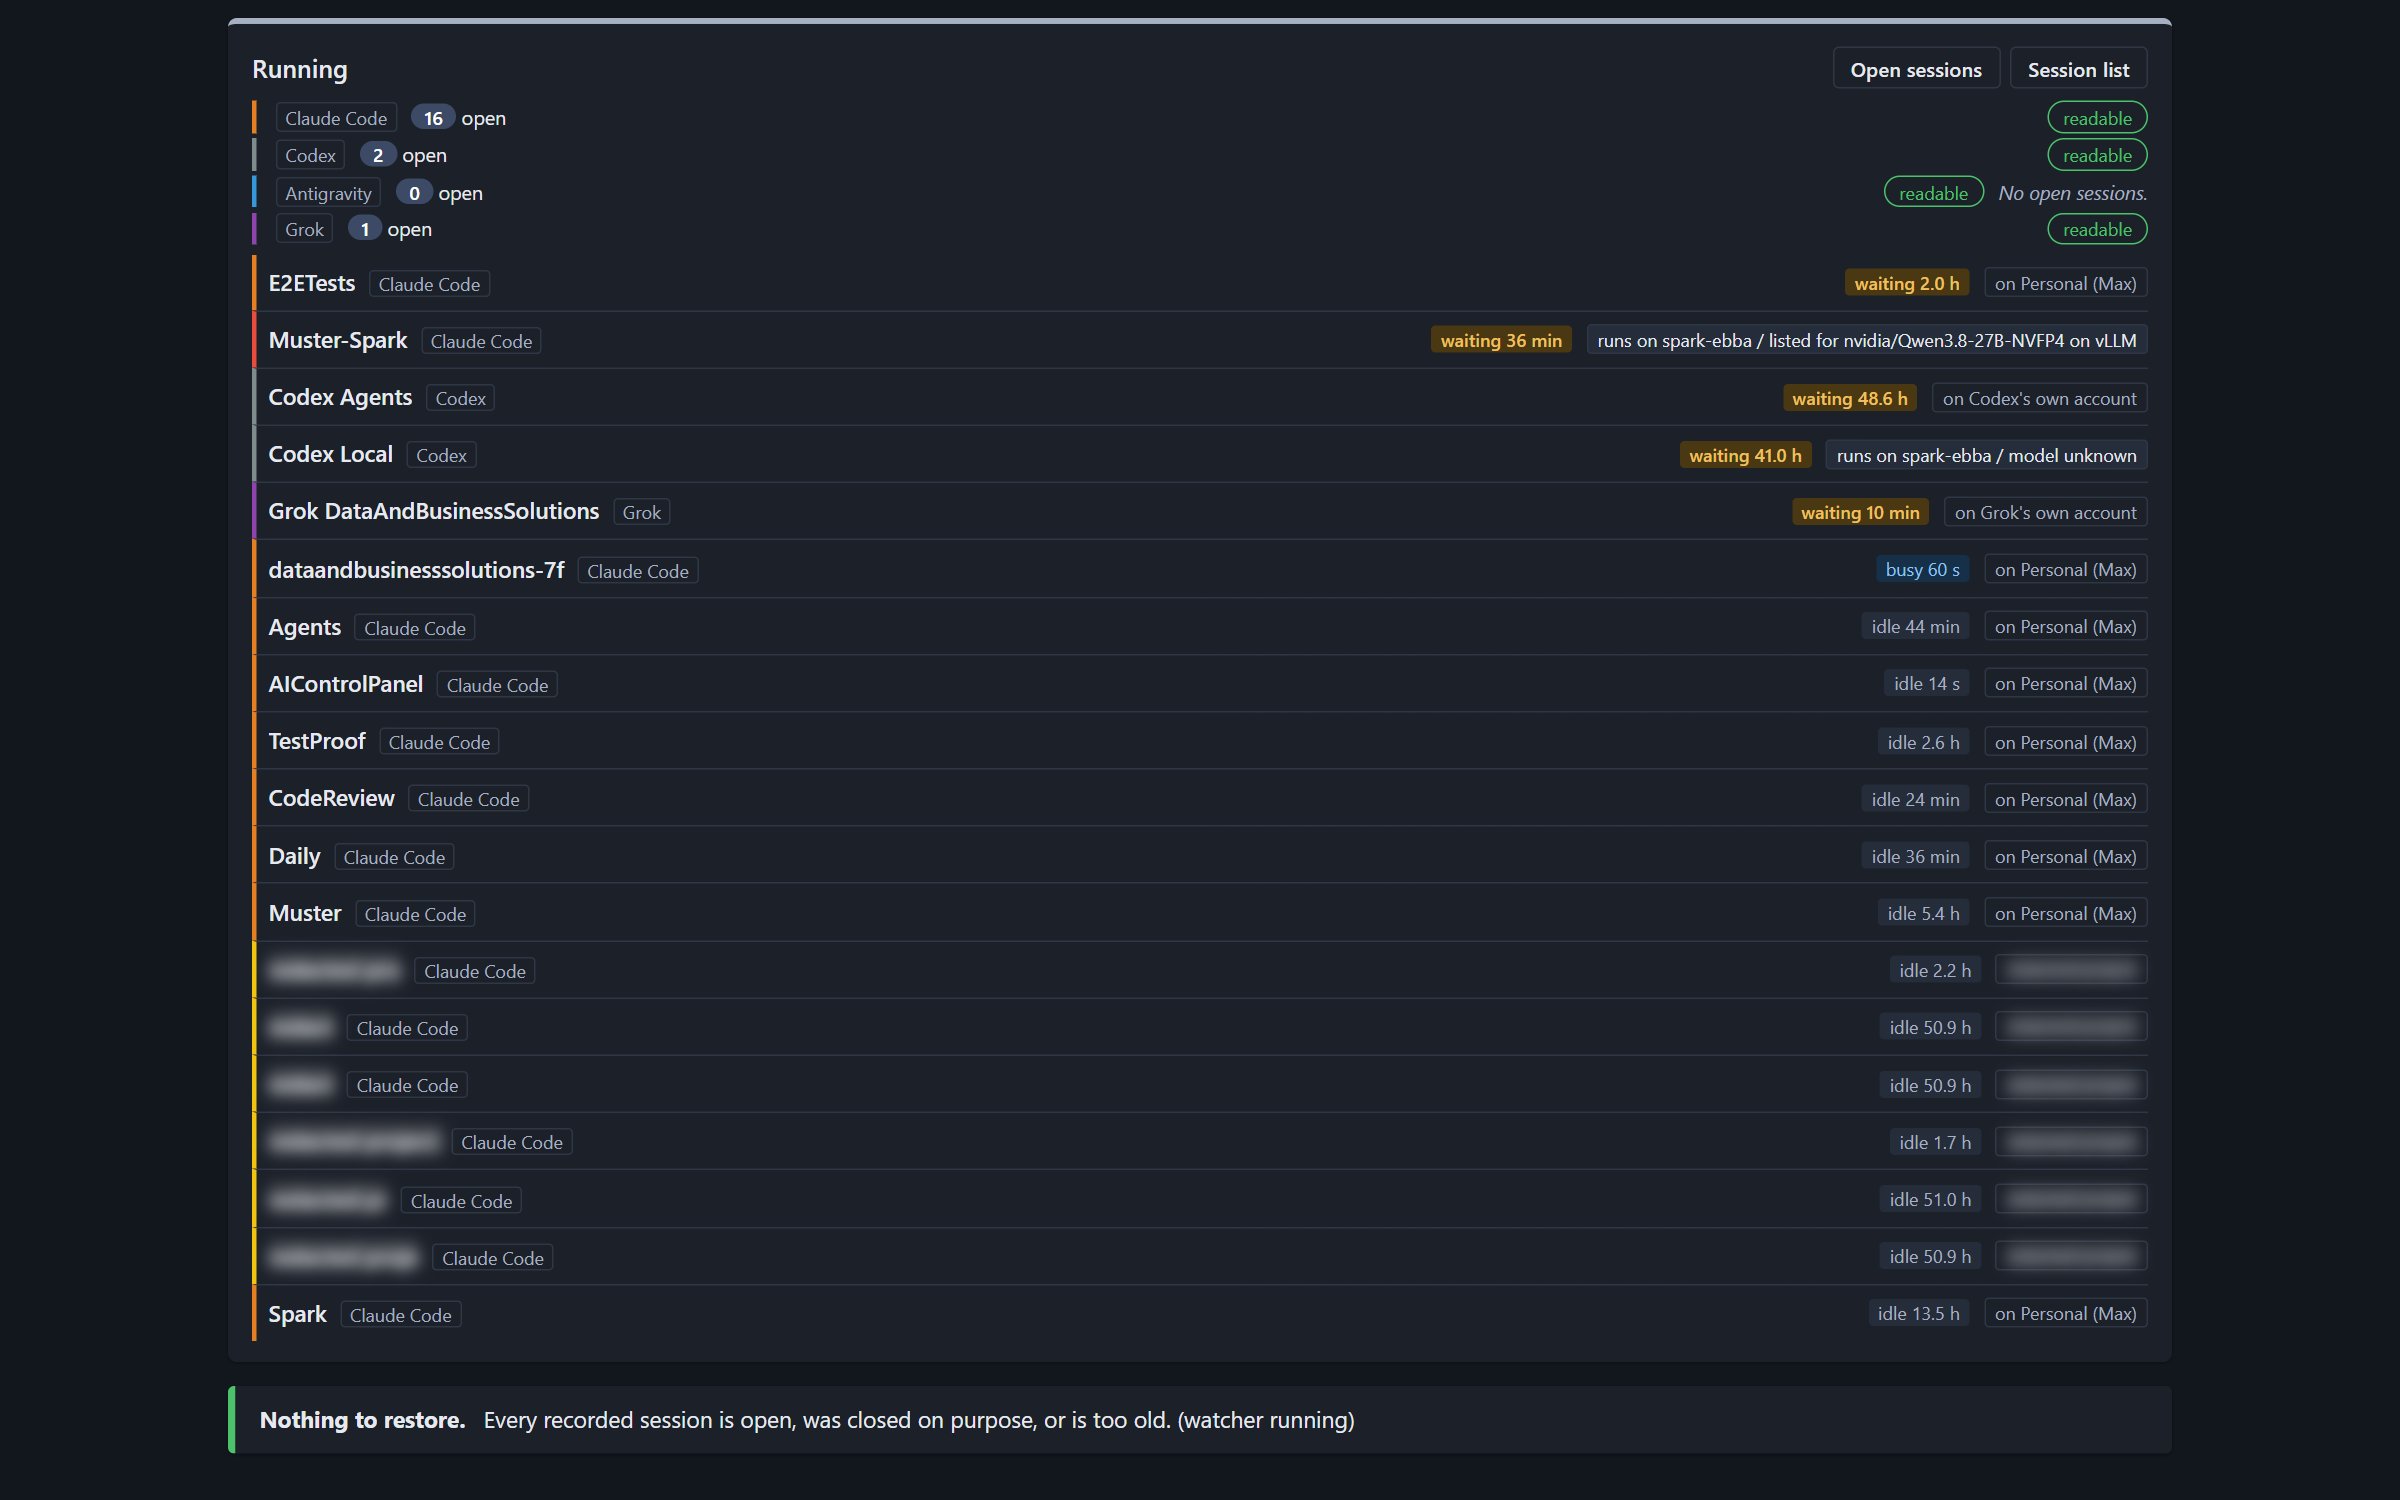
One of those rows says "runs on spark-ebba / listed for nvidia/Qwen3.8-27B-NVFP4 on vLLM." That is a Claude Code session doing real work in a project folder with the model on my desk instead of in a data center. I blurred the rows that belong to client work, and every folder path.
Launching a session, local or not
Every session the panel opens is a Windows Terminal tab with the folder already set and the tab named. The panel does not wrap the CLI or sit in the middle. When the tab is open it is just the tool.
The Add a session form is where the local work starts.
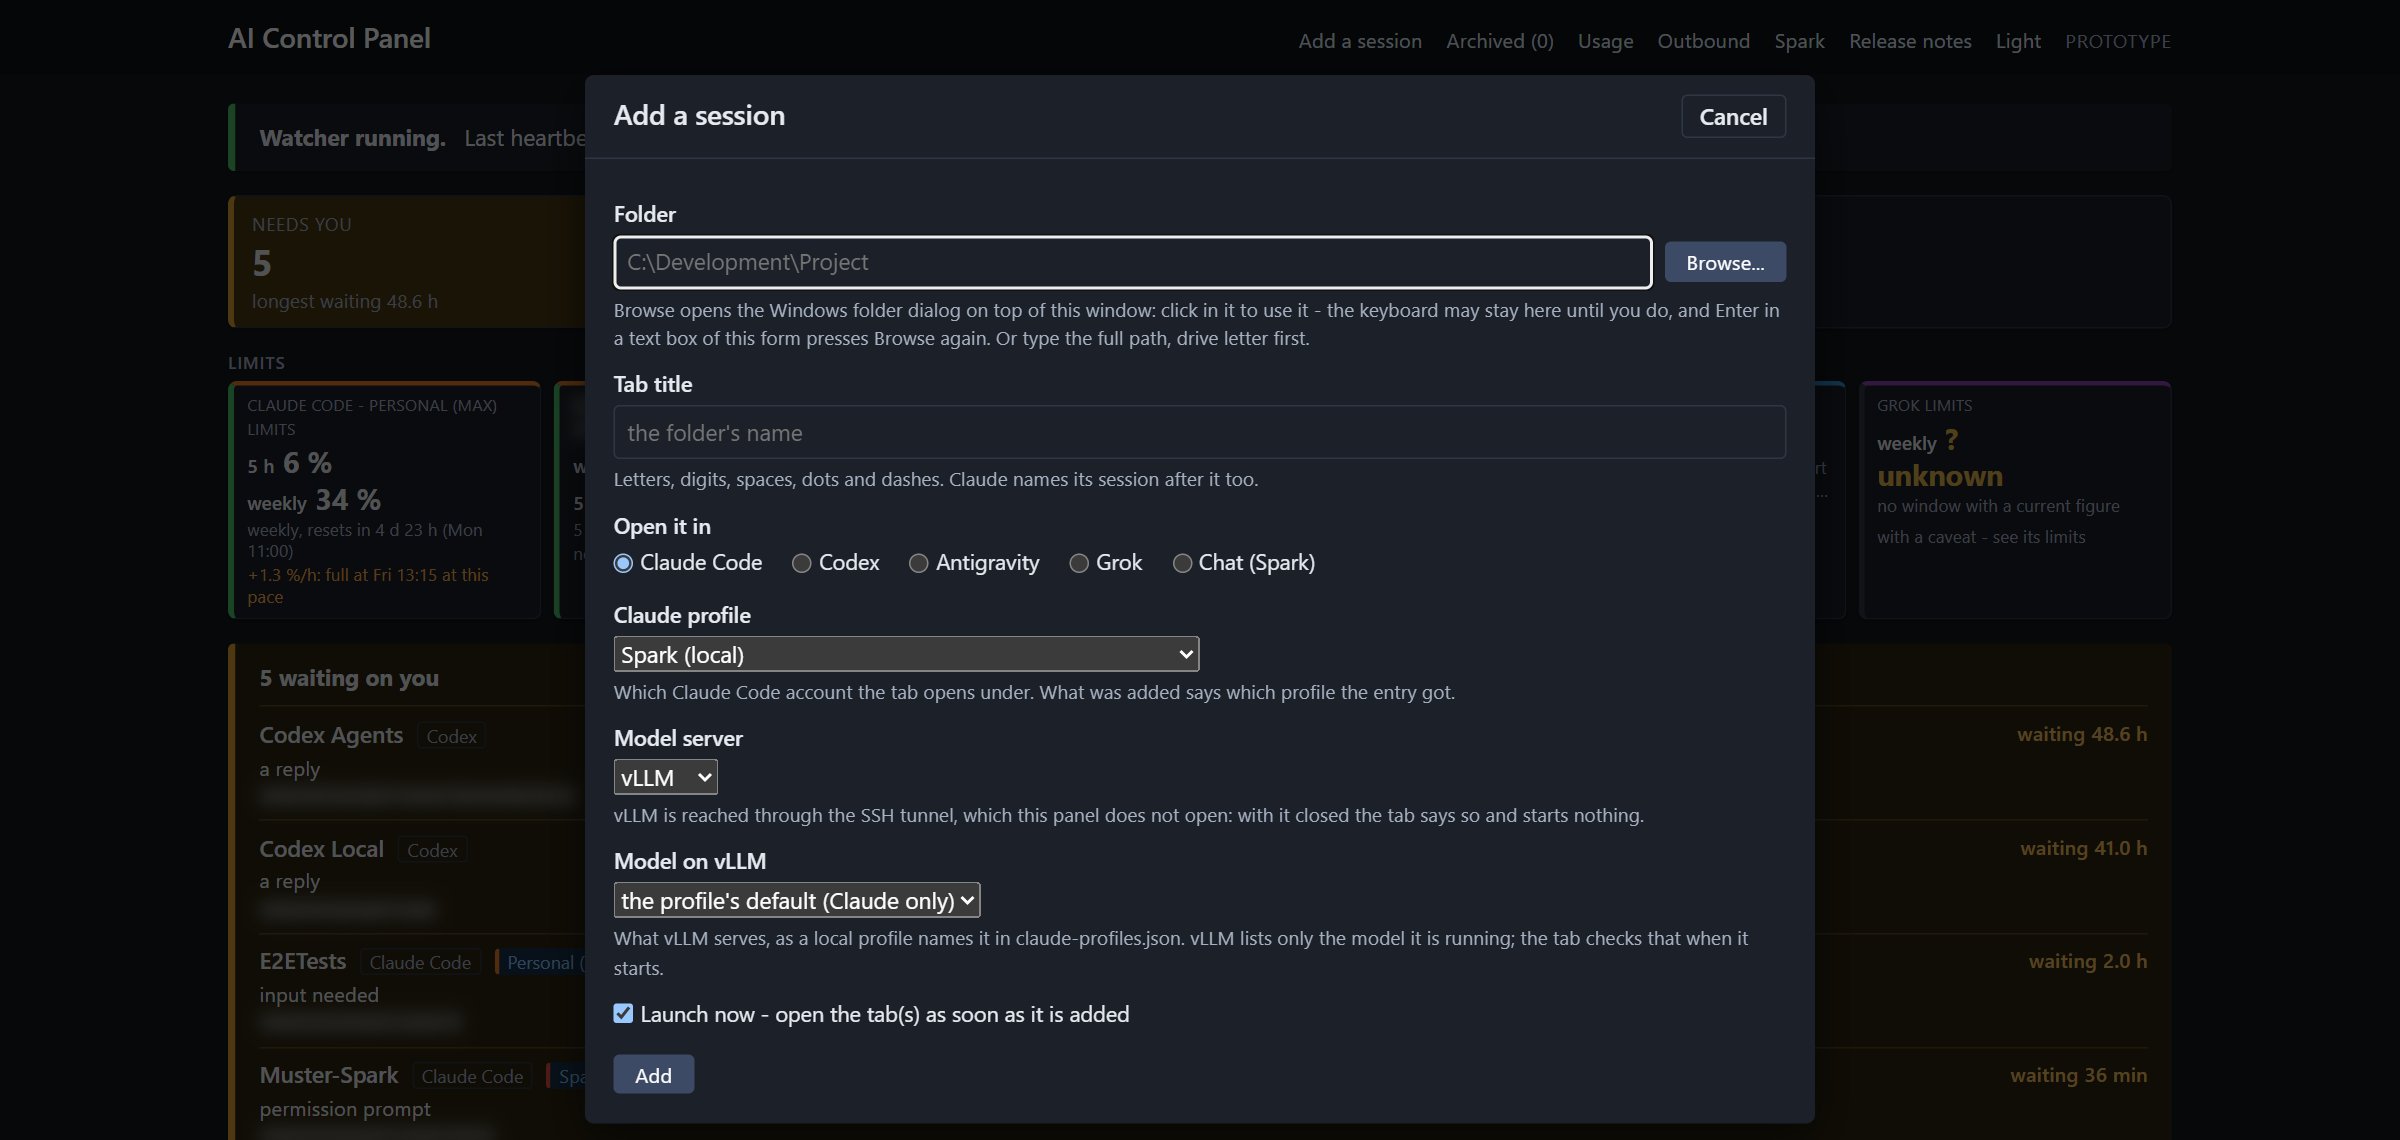
Claude Code opens under a profile. A profile is an account: each one keeps its own config folder, so my personal plan and a second account never share a login, a history or a limit. I can pin a folder to a profile so a project always opens on the right account. The Spark (local) profile is different. It hands the tab to a script on my side that points Claude Code at the Spark, picks the model server (Ollama or vLLM) and the model, and starts it with a lean setup. The model list is not typed in. It comes from what the Spark says is installed.
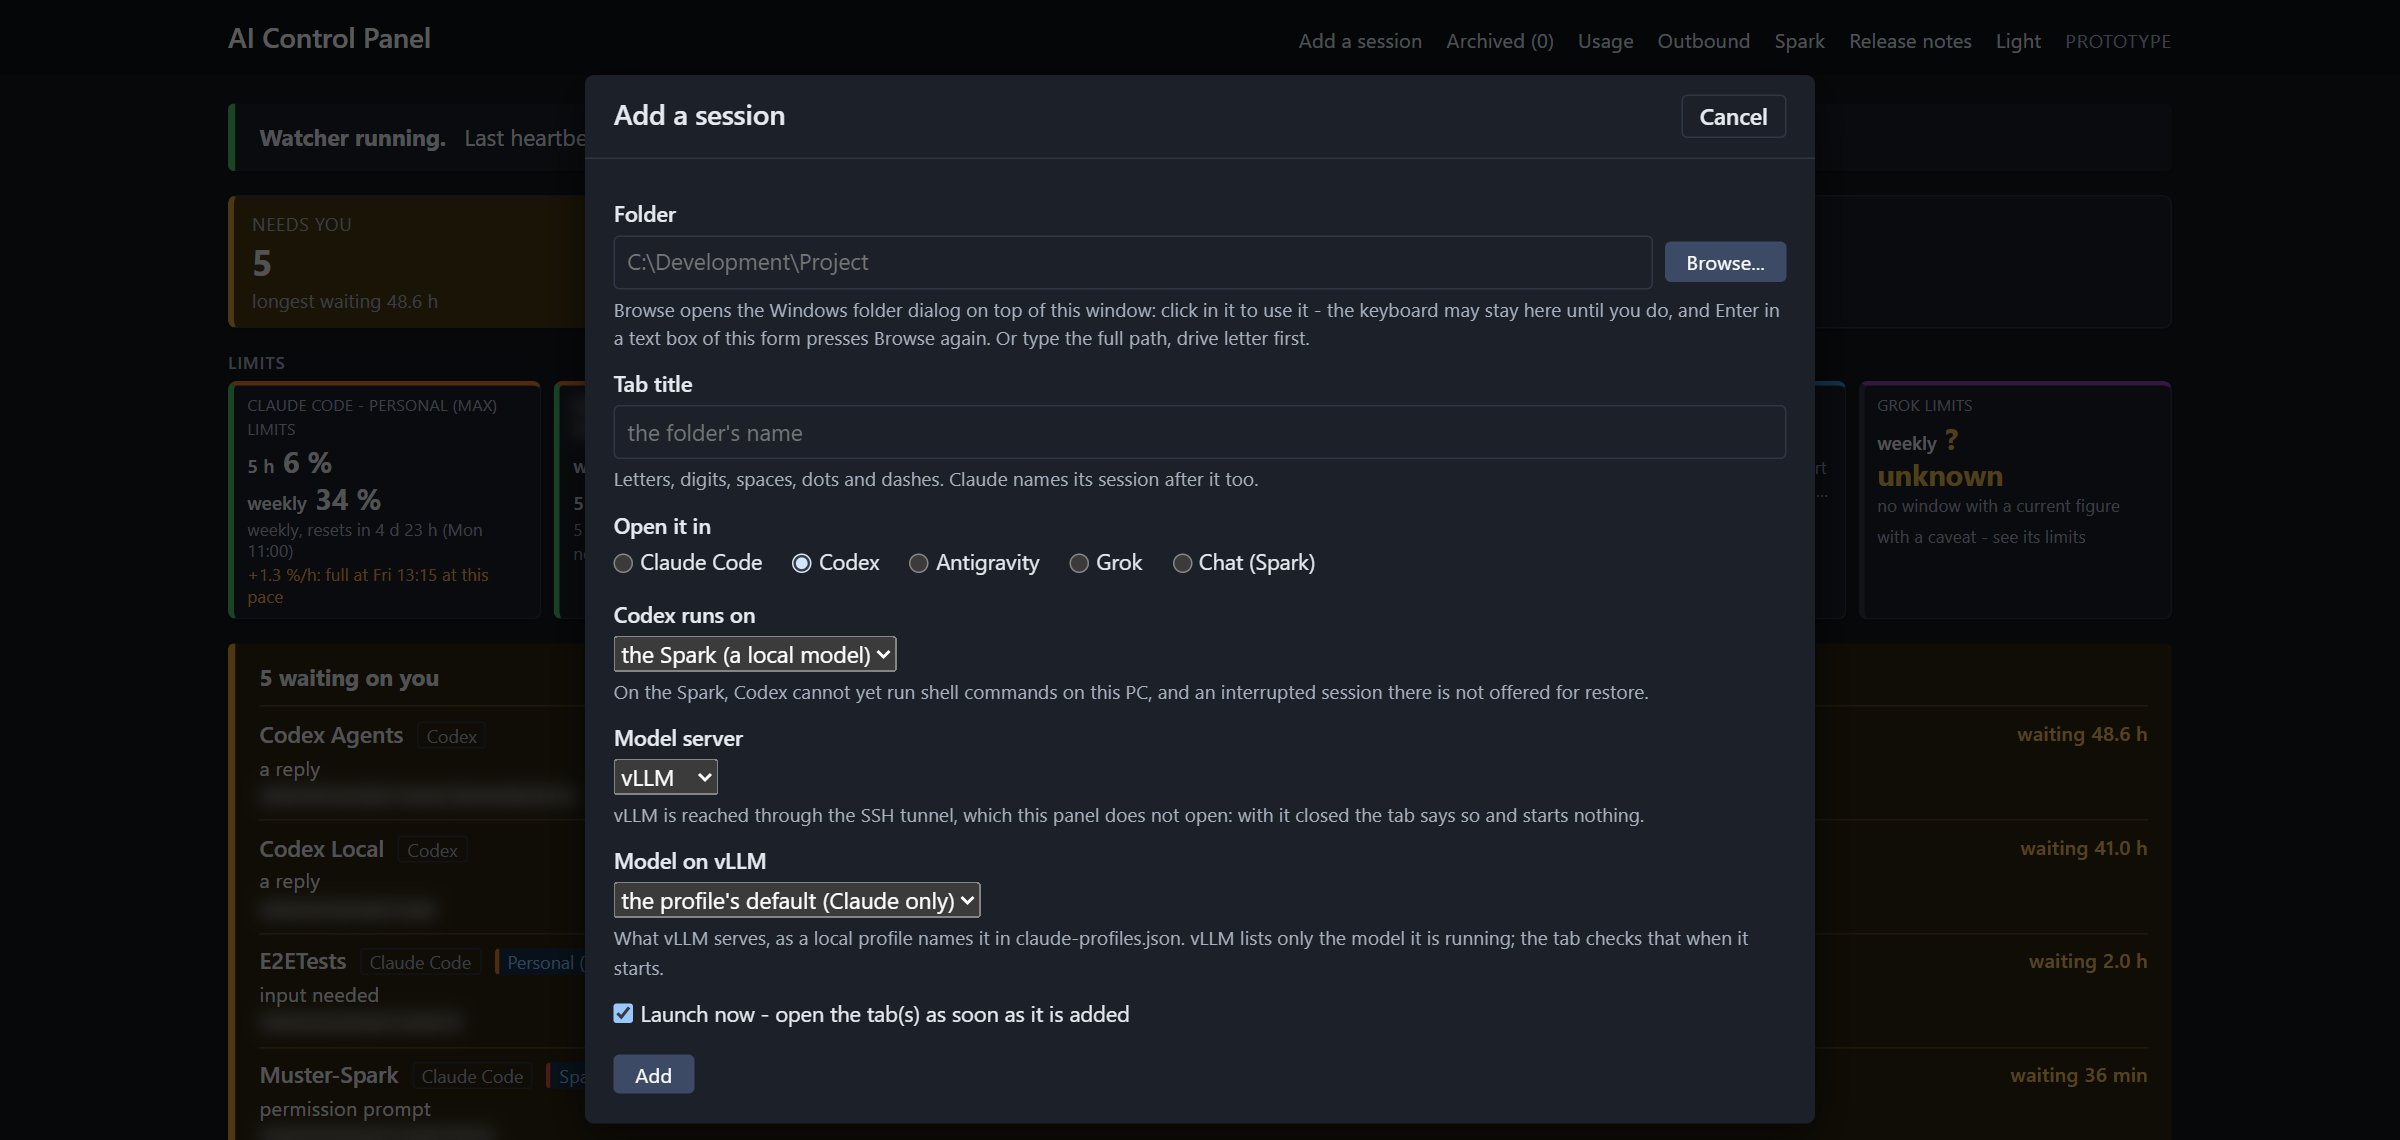
Codex can run on its own account or on the Spark. The form tells you plainly what does not work yet: on the Spark, Codex cannot run shell commands on this PC, and an interrupted session there is not offered for restore. I would rather the screen say that than find out halfway through a task.
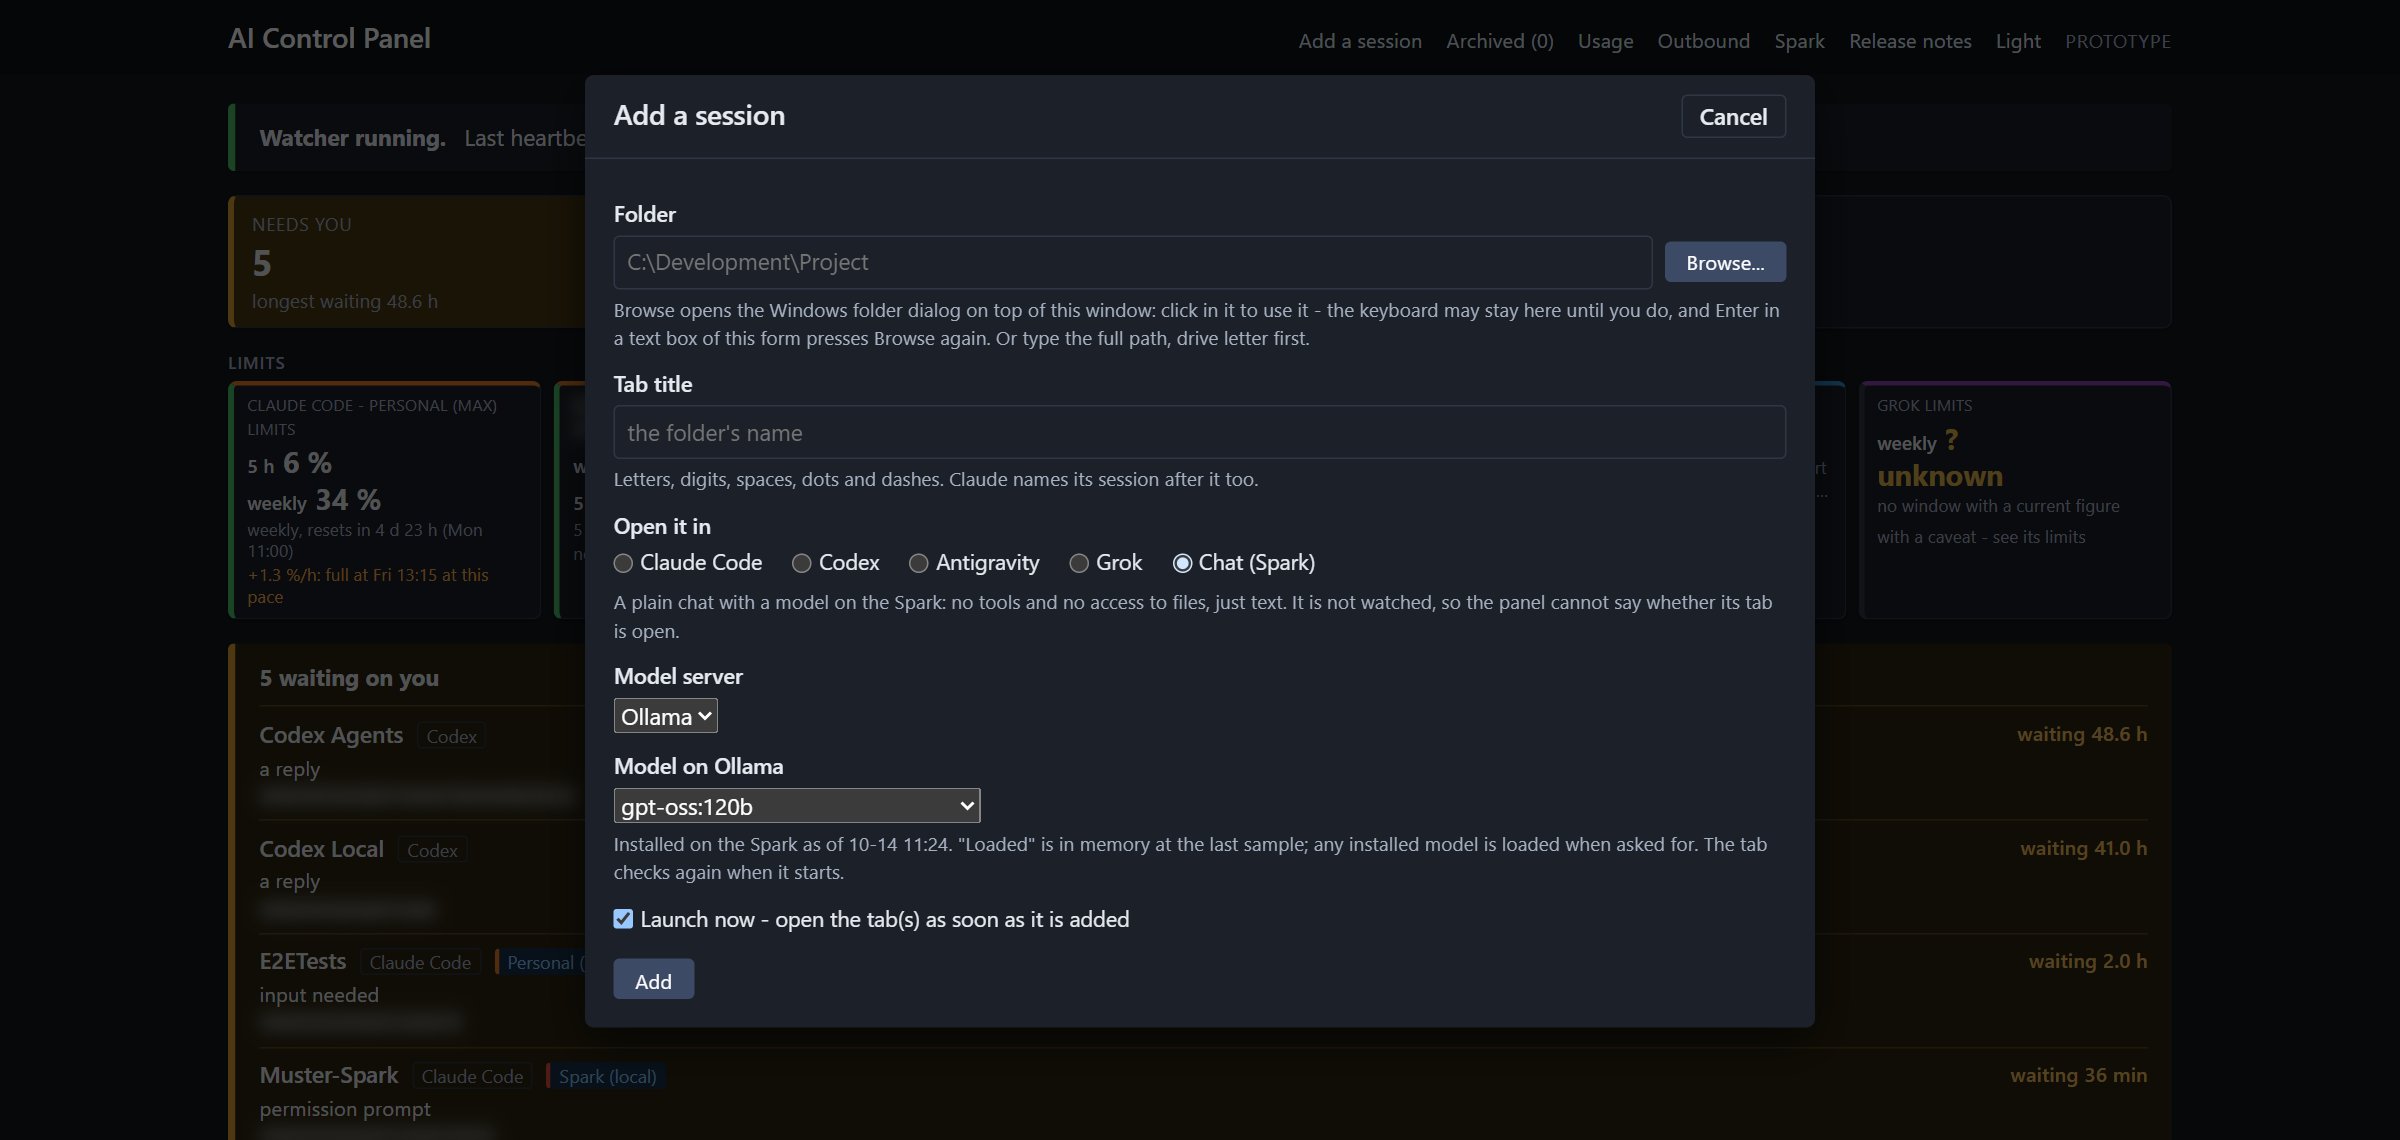
Chat (Spark) is a plain chat in a terminal tab with whatever model is loaded on the Spark. No tools and no file access, just text. That is the one I use when I want to ask a 120 billion parameter model something and I do not want it anywhere near a file.
Every session it launches gets recorded. If the machine reboots or a tab crashes, the panel lists what was interrupted and reopens the ones I pick, back in the same conversation. It never restores anything by itself.
When a session is waiting on me
With 19 sessions open, the expensive mistake is not a bad answer. It is a session that finished 2 days ago and has been sitting there waiting for me to say yes.
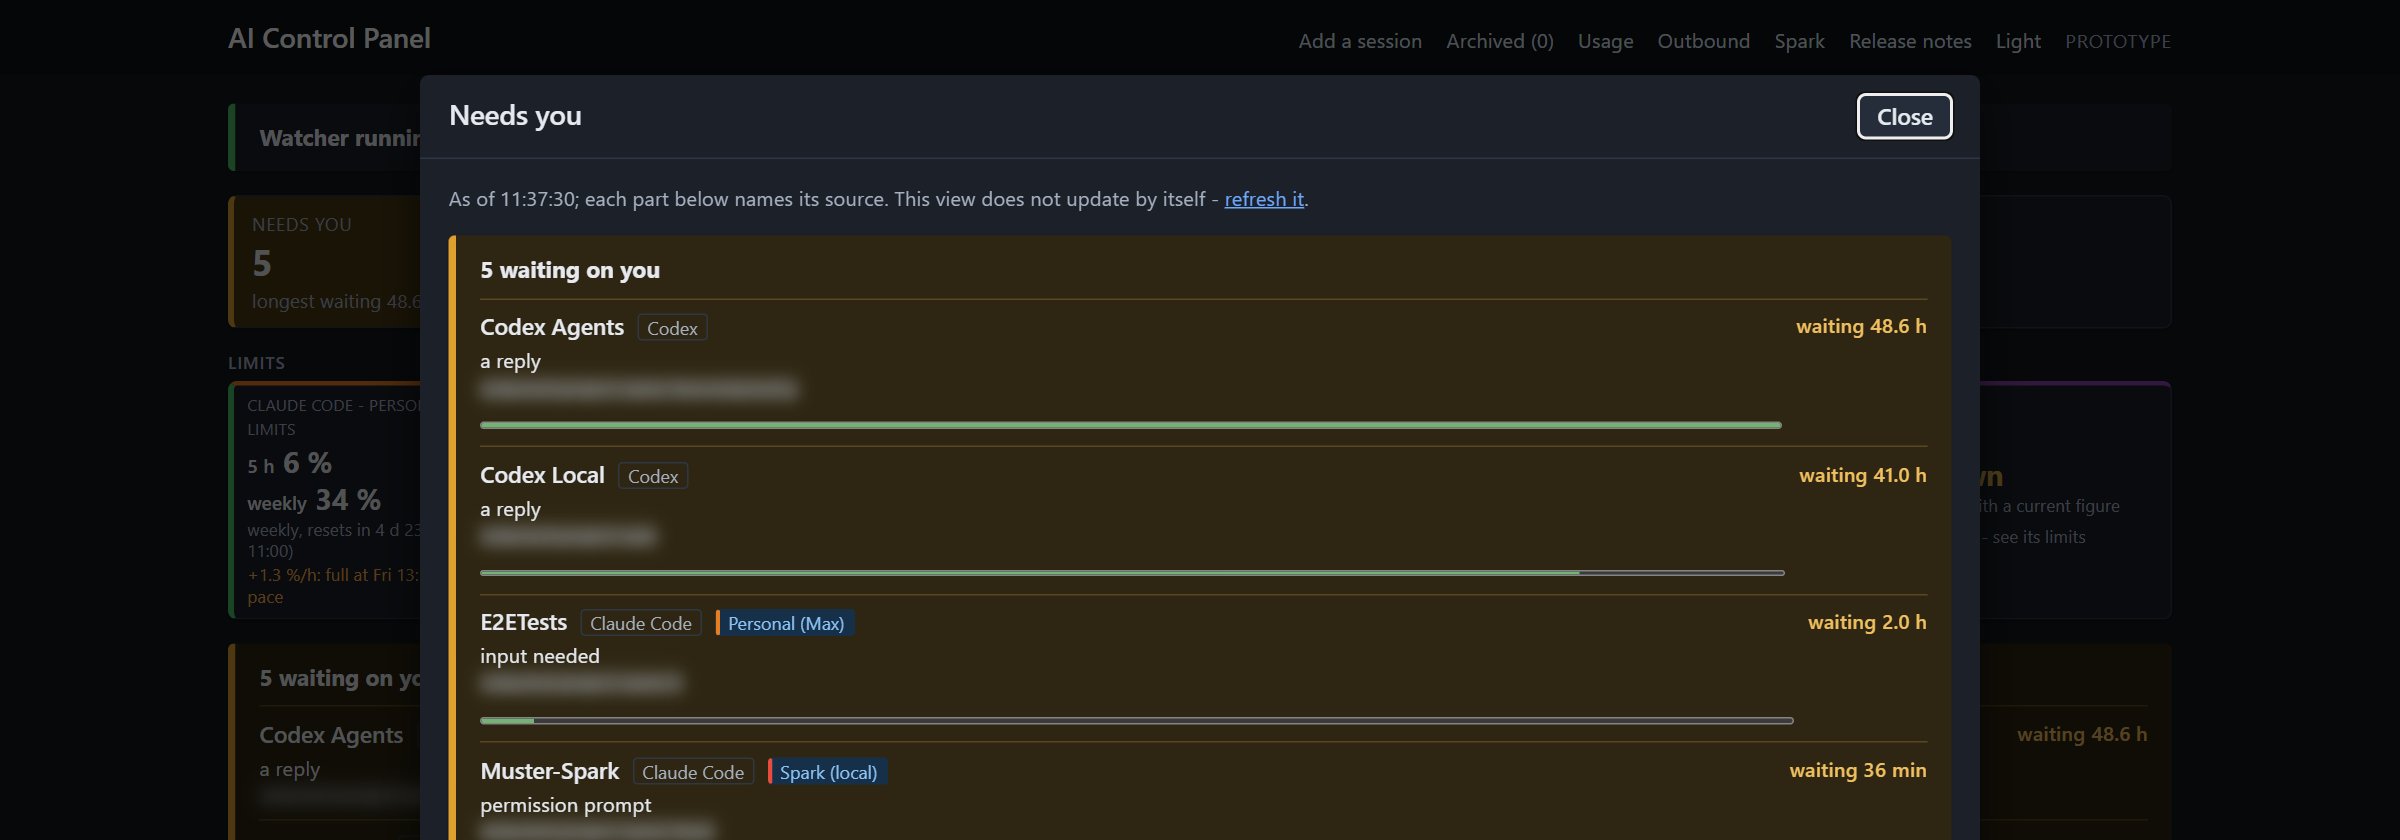
Needs you lists every session that is waiting, what it is waiting for (a reply, input it asked for, or a permission prompt), and for how long. One of them is the session on the Spark, stopped on a permission prompt. When I turn on notices, the browser tells me the moment a session starts waiting, and again when an account crosses 75% and 90% of a limit window. Clicking the notice opens that session. Two panel tabs open does not mean two notices.
Limits, and how fast I am burning them
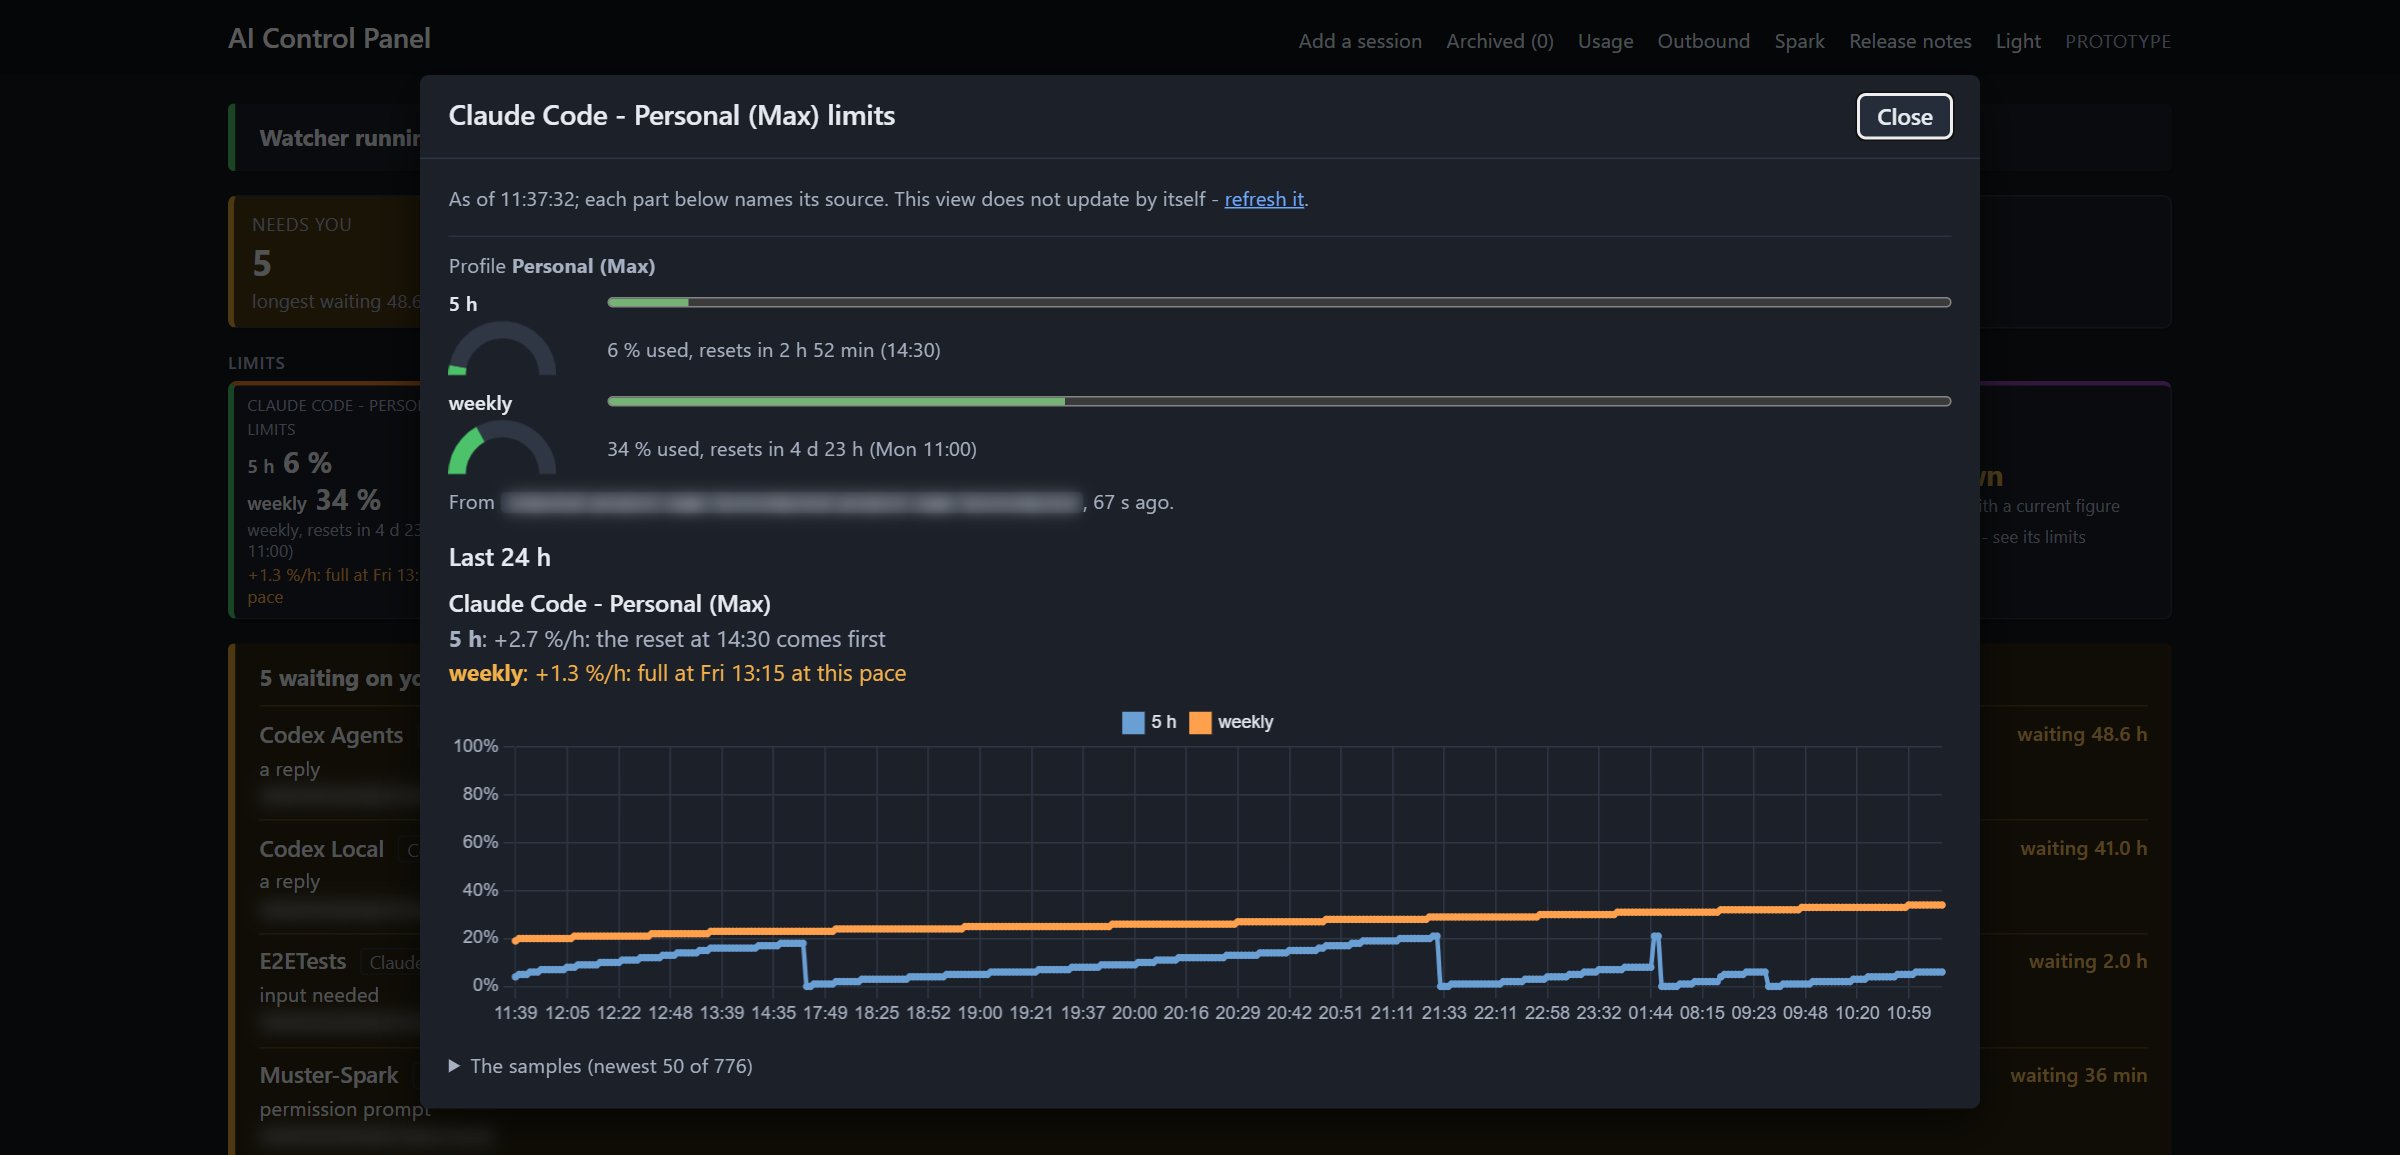
Each limit opens to its own history. The line under the gauge is the part I use: "weekly: +1.3 %/h: full at Fri 13:15 at this pace." That is the gas gauge with a range estimate on it. When a meter runs low I move the work to another account, another CLI, or the Spark.
Usage at list price
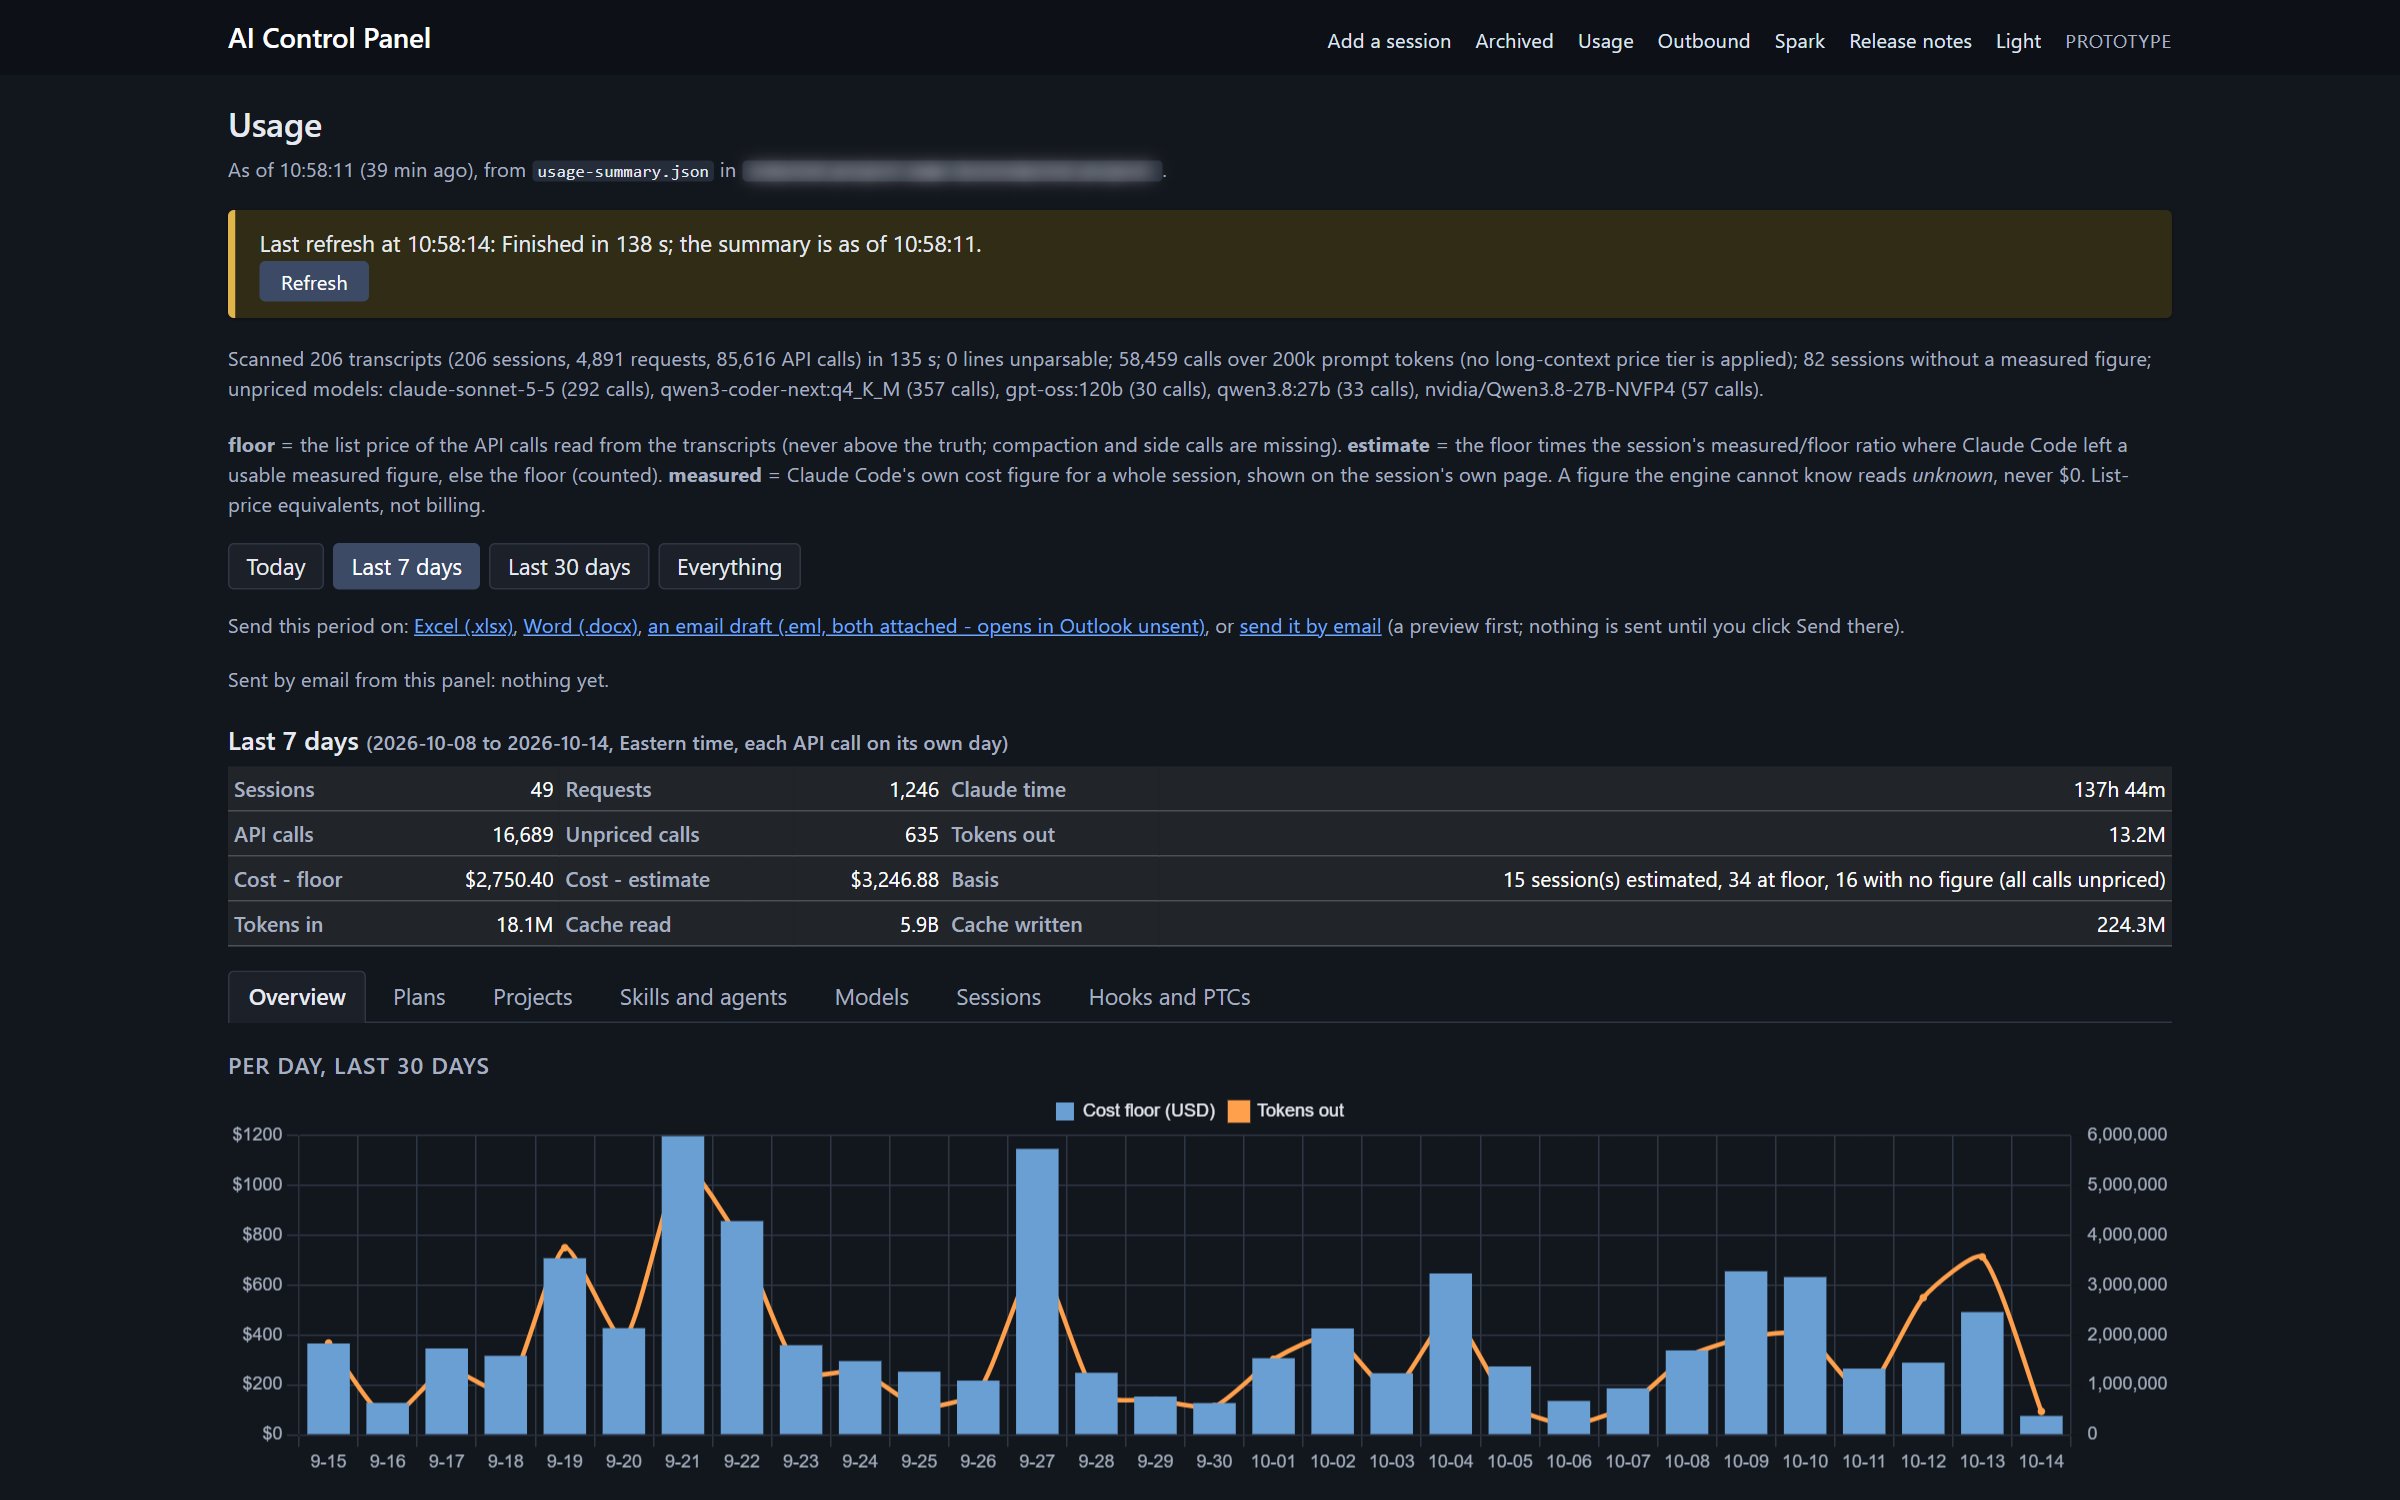
The Usage page reads every Claude Code transcript and prices each API call at list price. In the last 7 days that is 49 sessions, 16,689 API calls and a floor of $2,750.40. It is a list-price equivalent and not a bill. It never shows $0 for something it cannot price. It says unknown.
That matters for local models, because a model on the Spark has no list price.
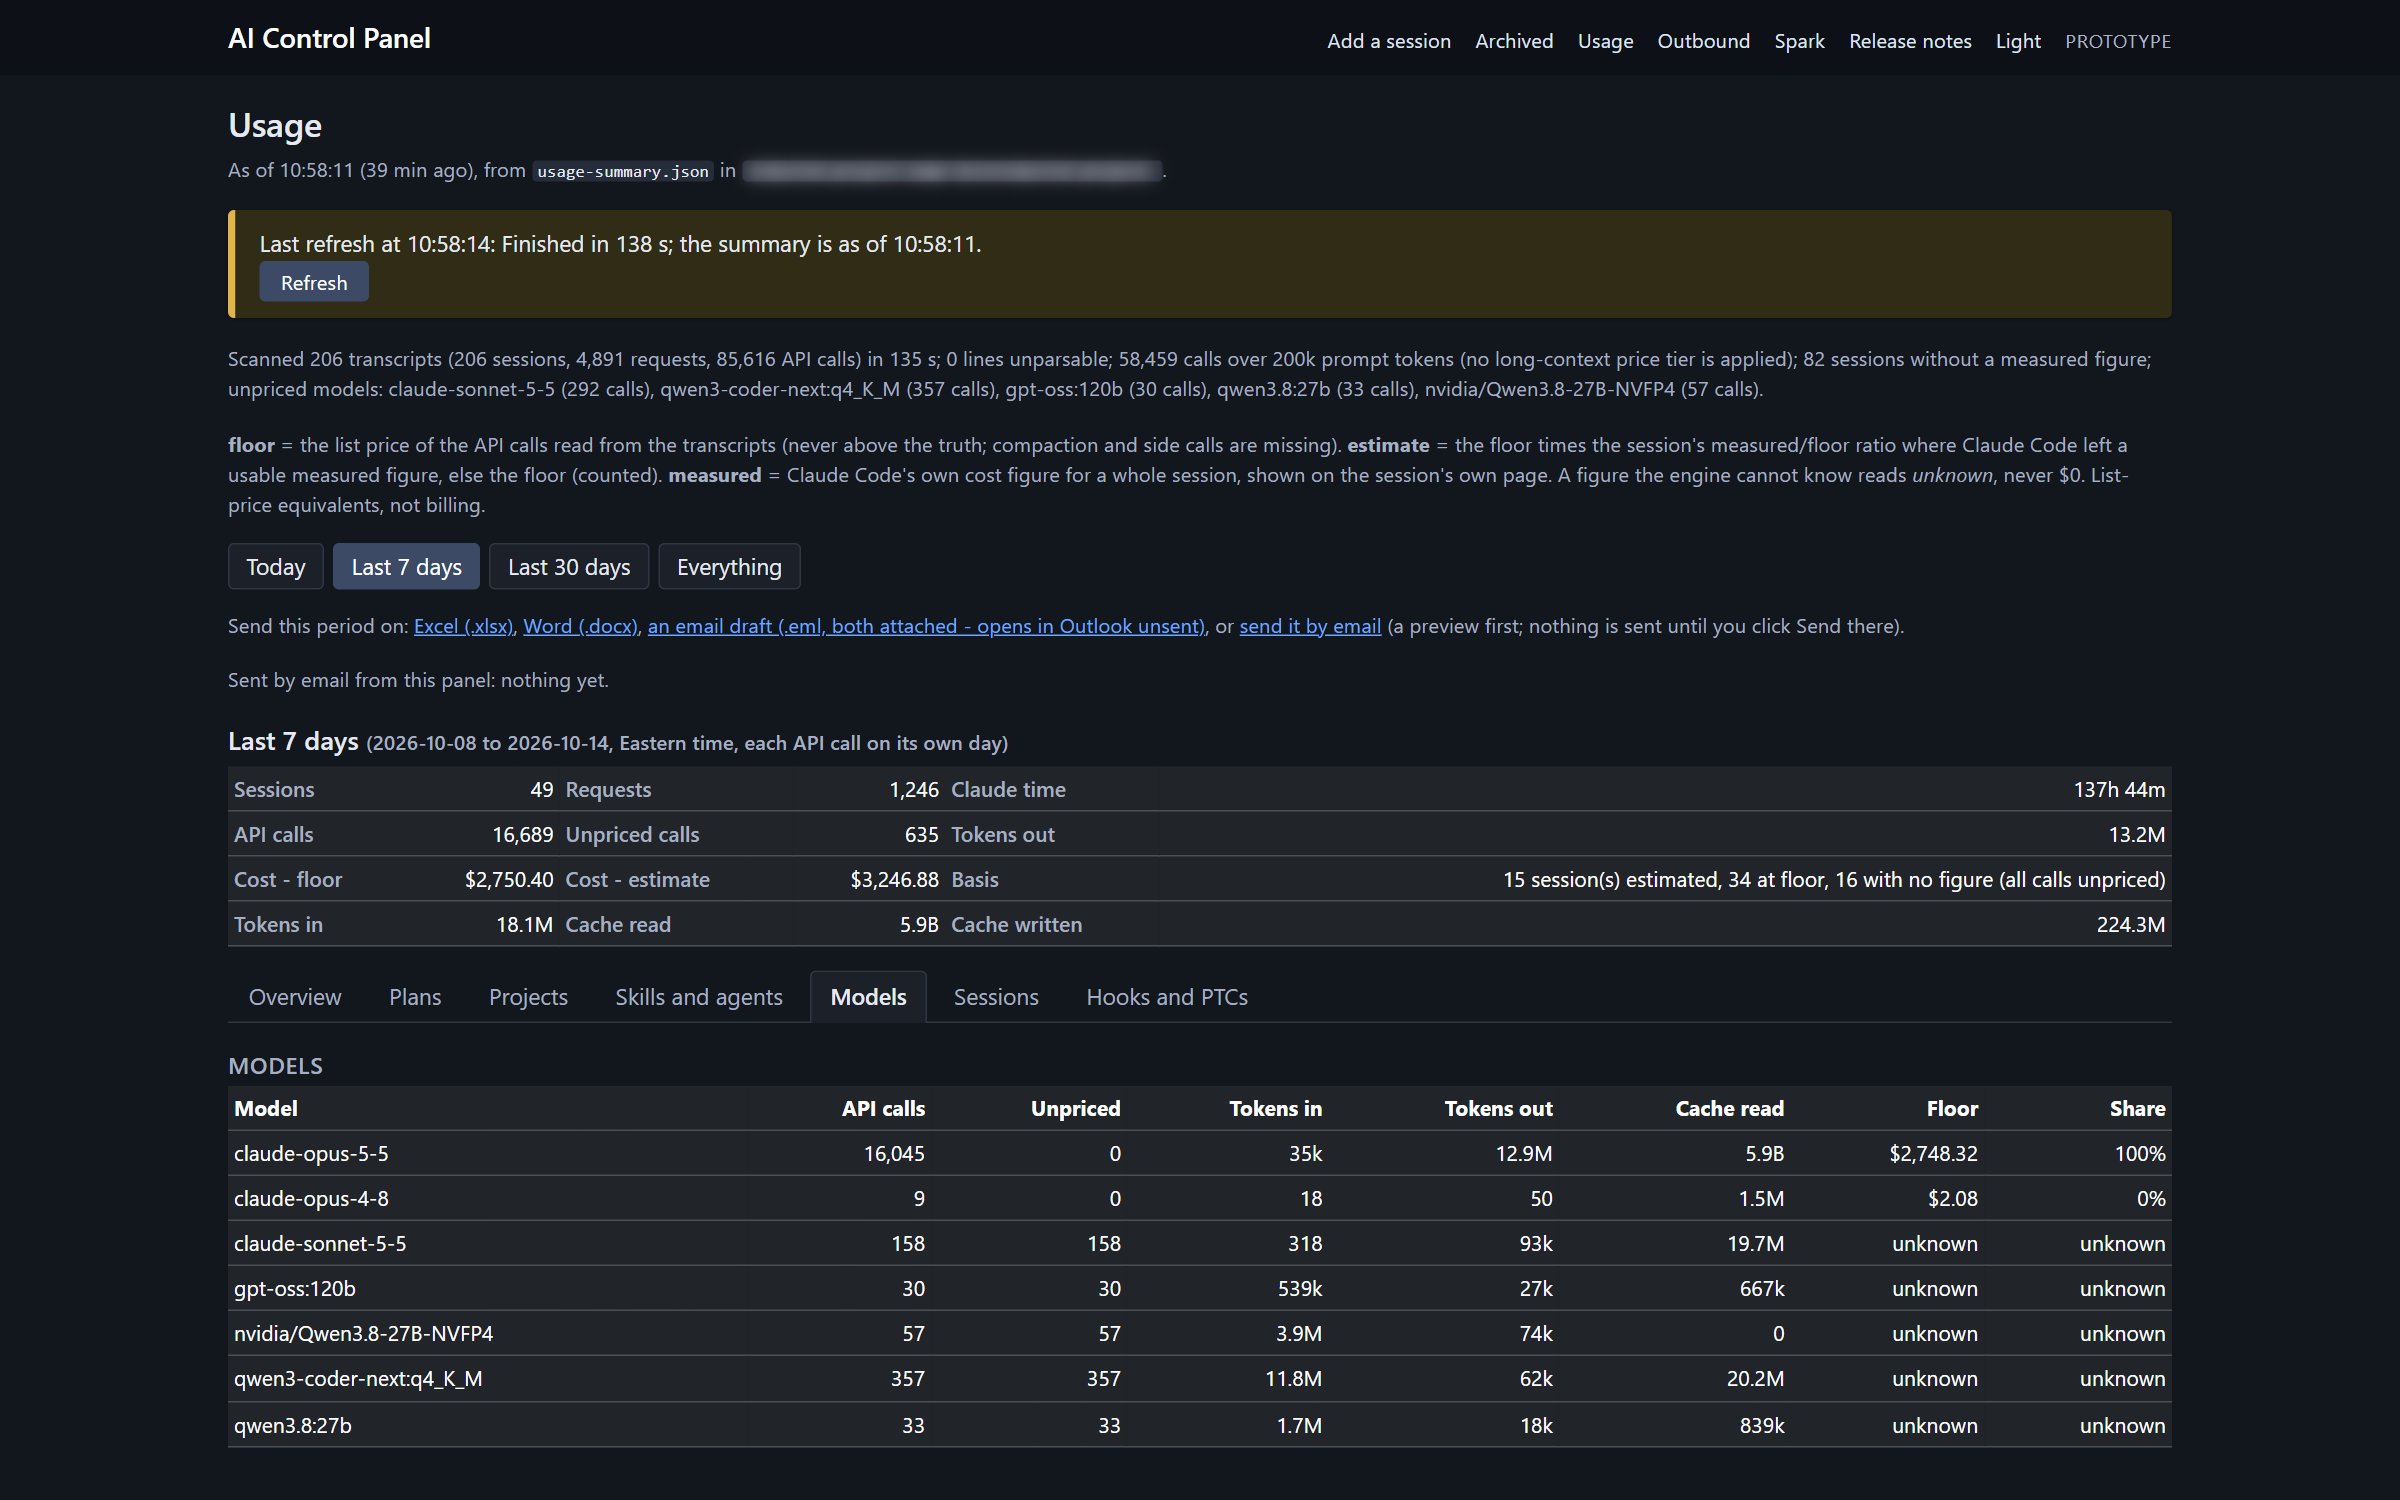
The local models show up beside the hosted ones with their calls and their tokens, and they stay unpriced. The Plans tab then does the comparison I actually wanted.
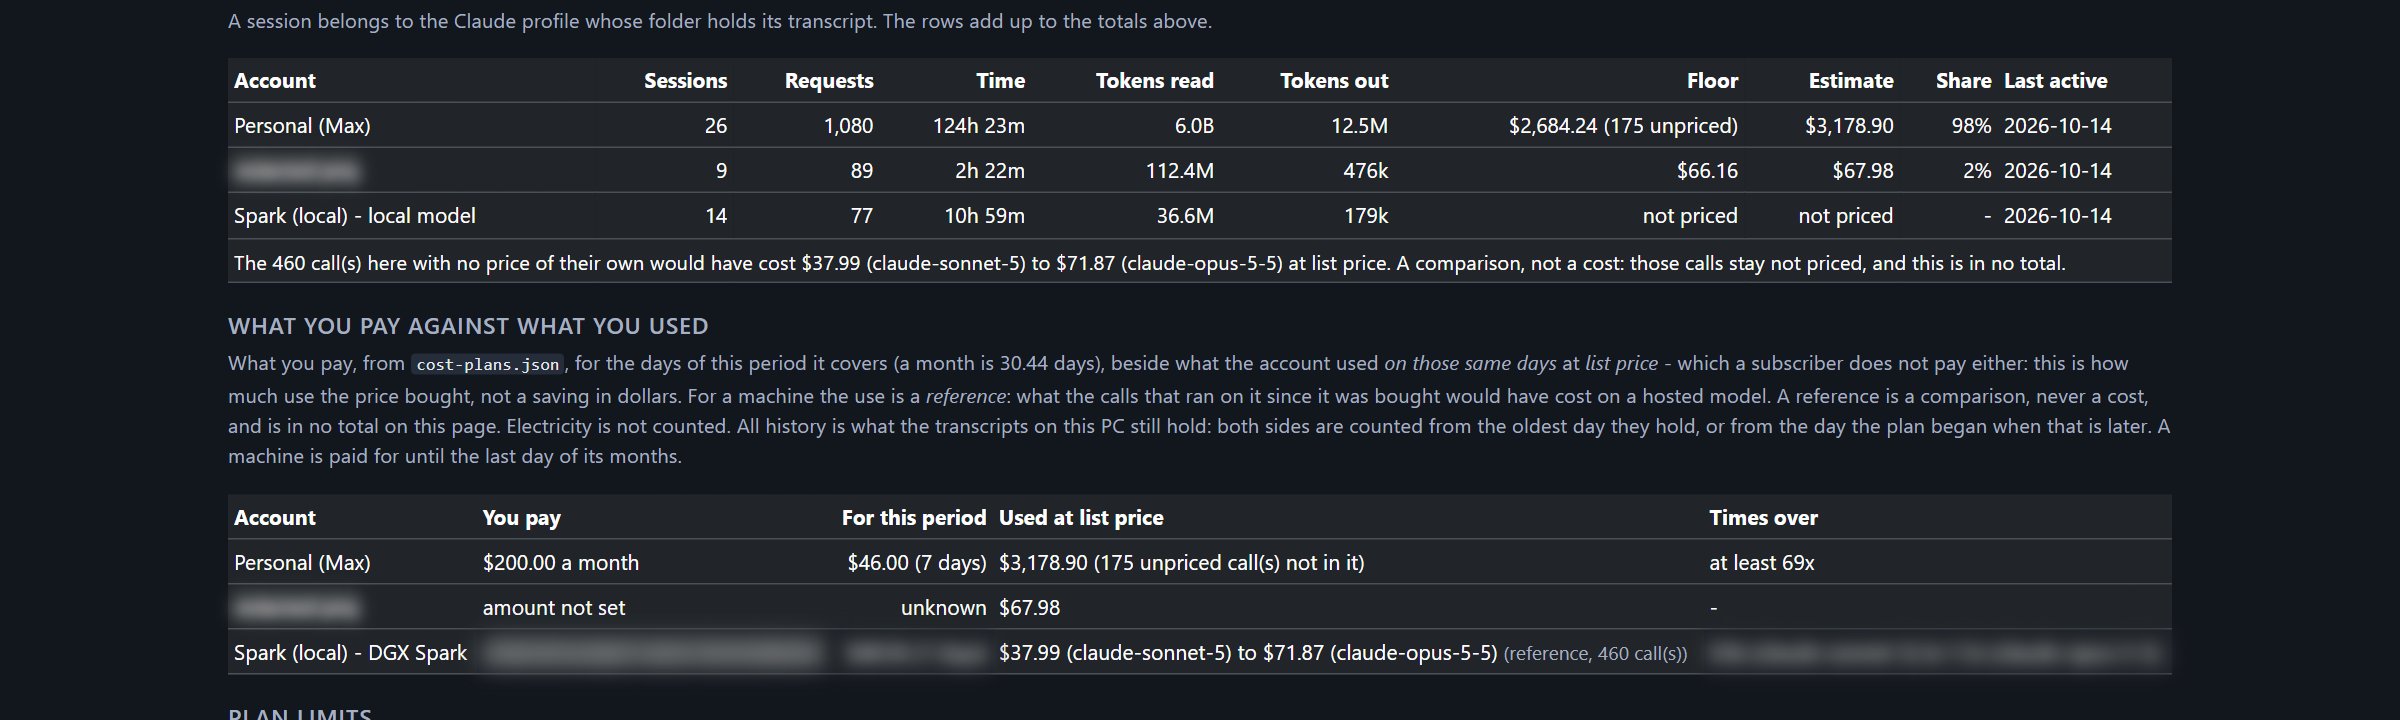
The $2,750.40 above is the floor for every account. On the Plans tab the Max plan's own estimate for the same 7 days is $3,178.90 at list price, against the $46 of a $200 a month plan that those 7 days cover. That is the 69 times. The footnote above the table counts 460 Claude Code calls that ran on the Spark, and says they would have cost $37.99 to $71.87 on a hosted Claude model. The panel calls that a reference, never a saving, because electricity is not counted and the machine is paid for whether I use it or not.
The outbound list
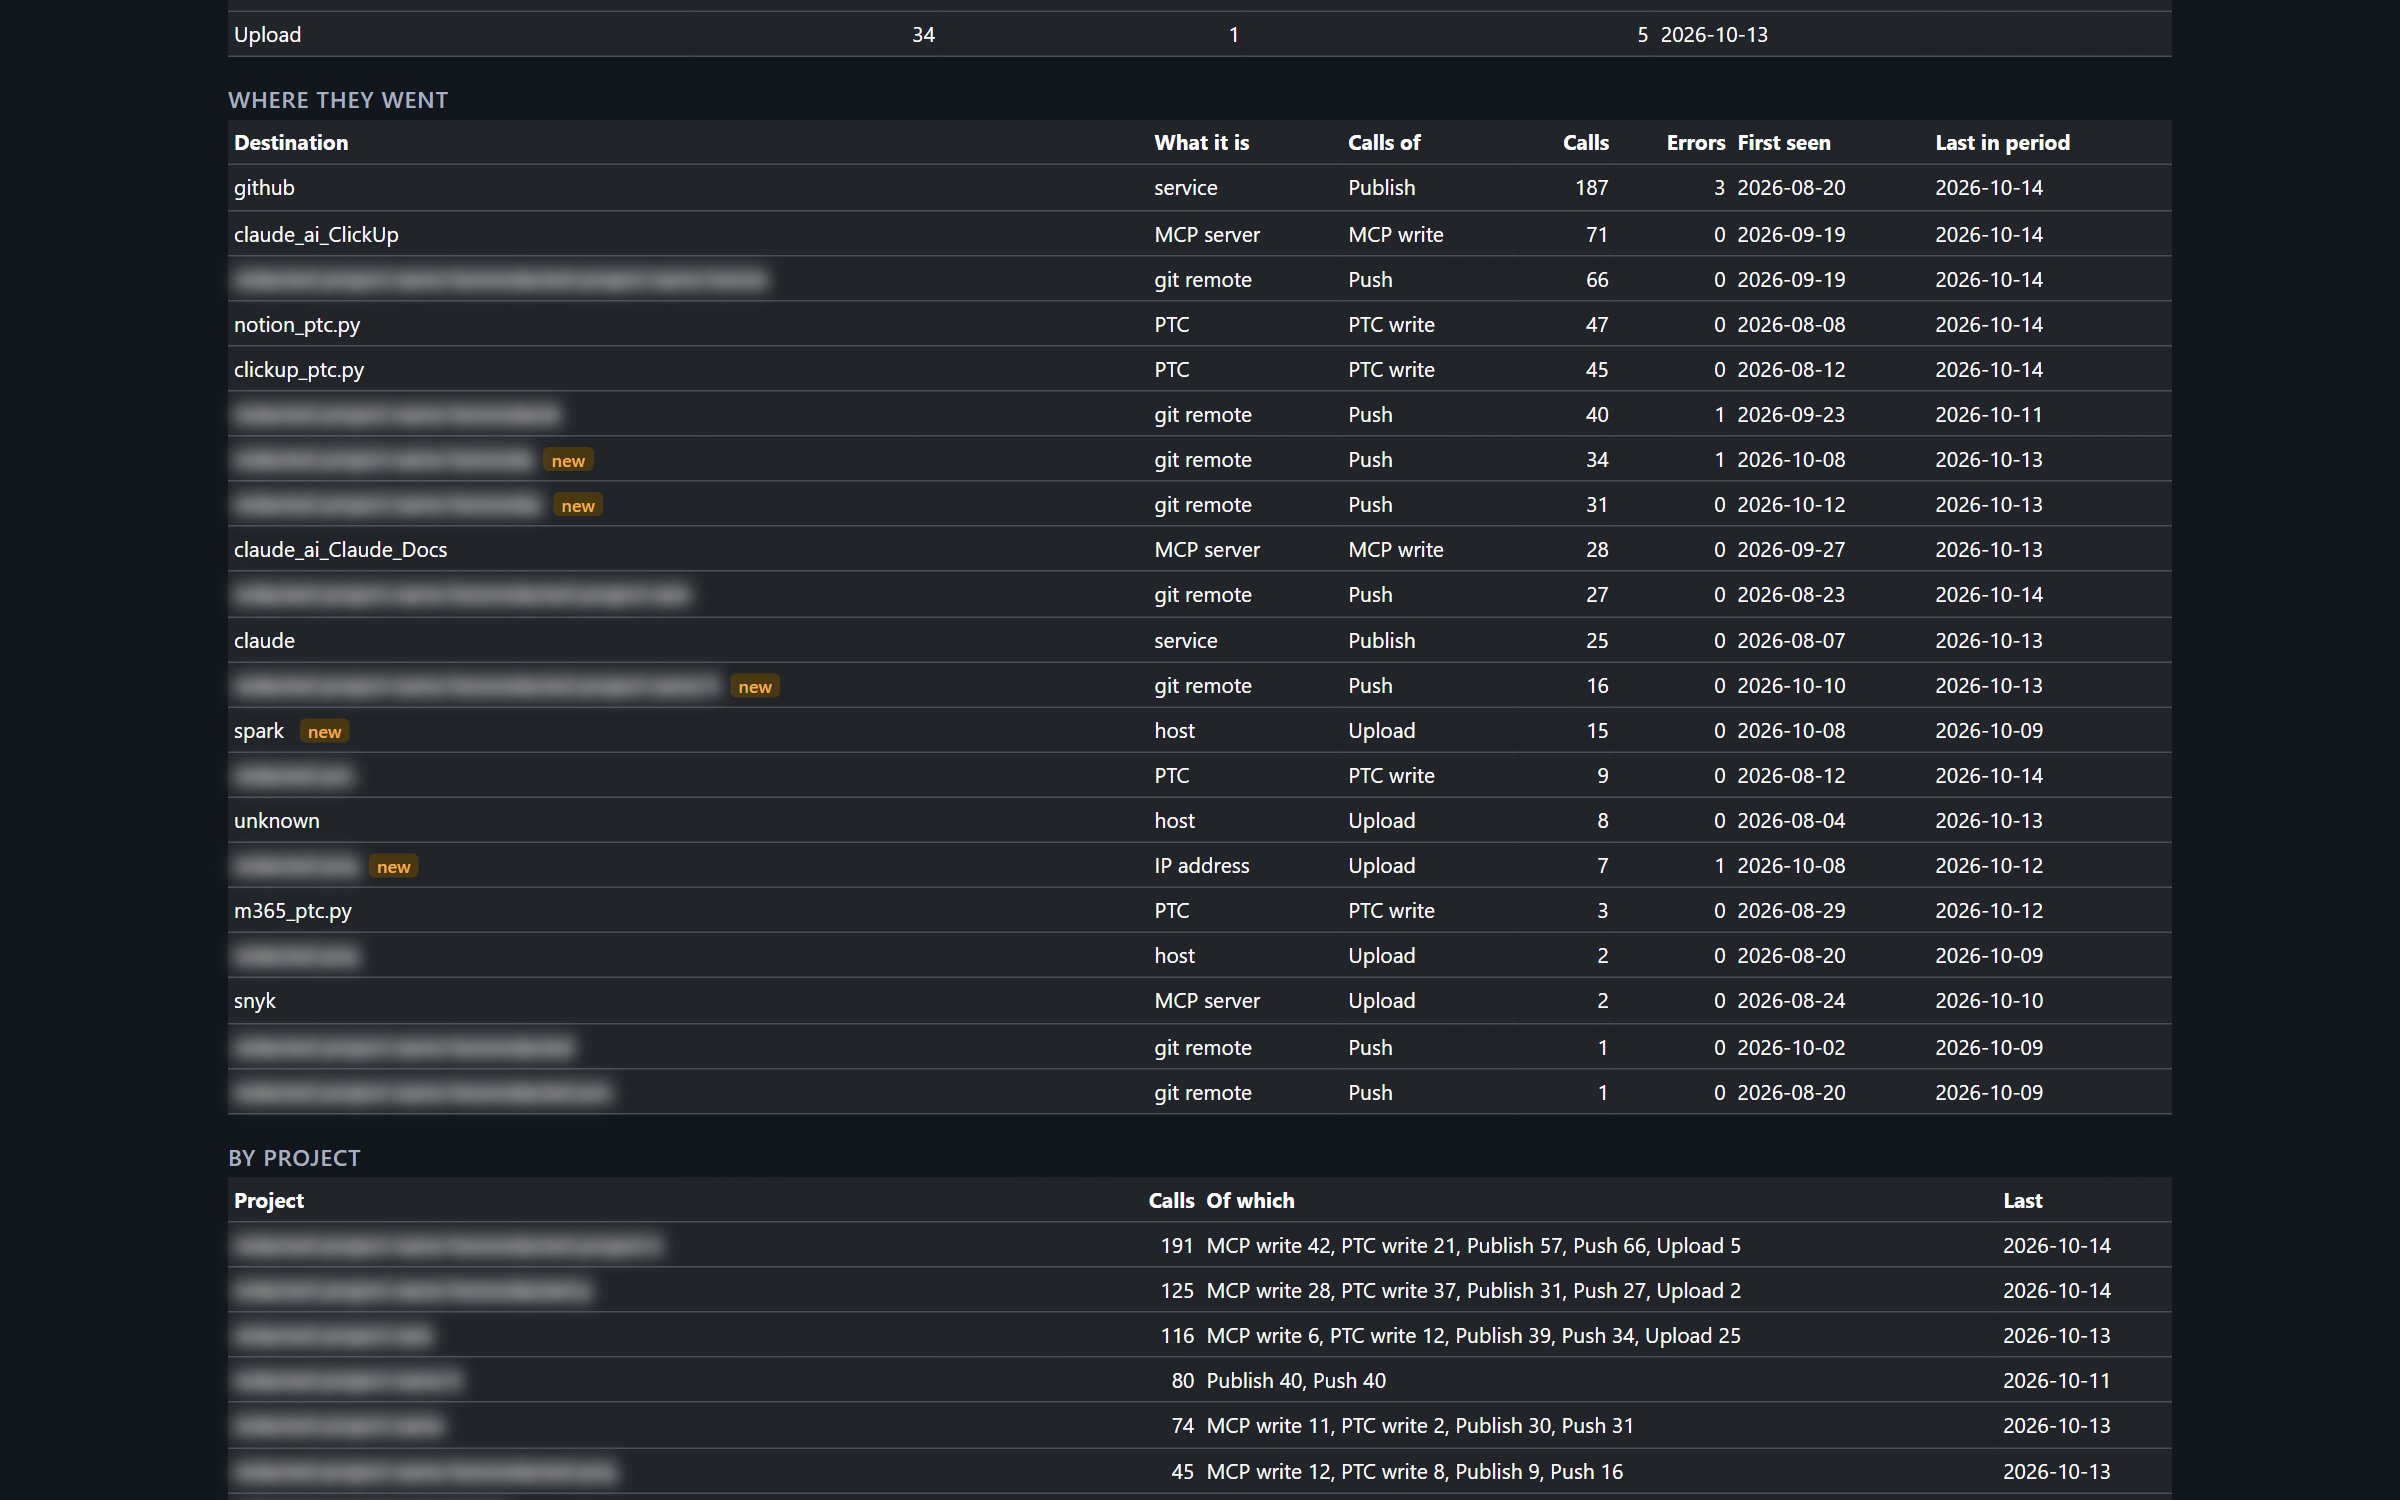
This is the page I built first. Every tool call that says it sends something off the machine, grouped by destination: 665 calls in the last 7 days to 21 destinations, 5 of them new. A new host or git remote turns the home page tile amber for 2 days.
These are attempts read from what the call said it would do. It is not a network monitor and I do not call it an audit. It is the list an audit would start from.
The Spark page
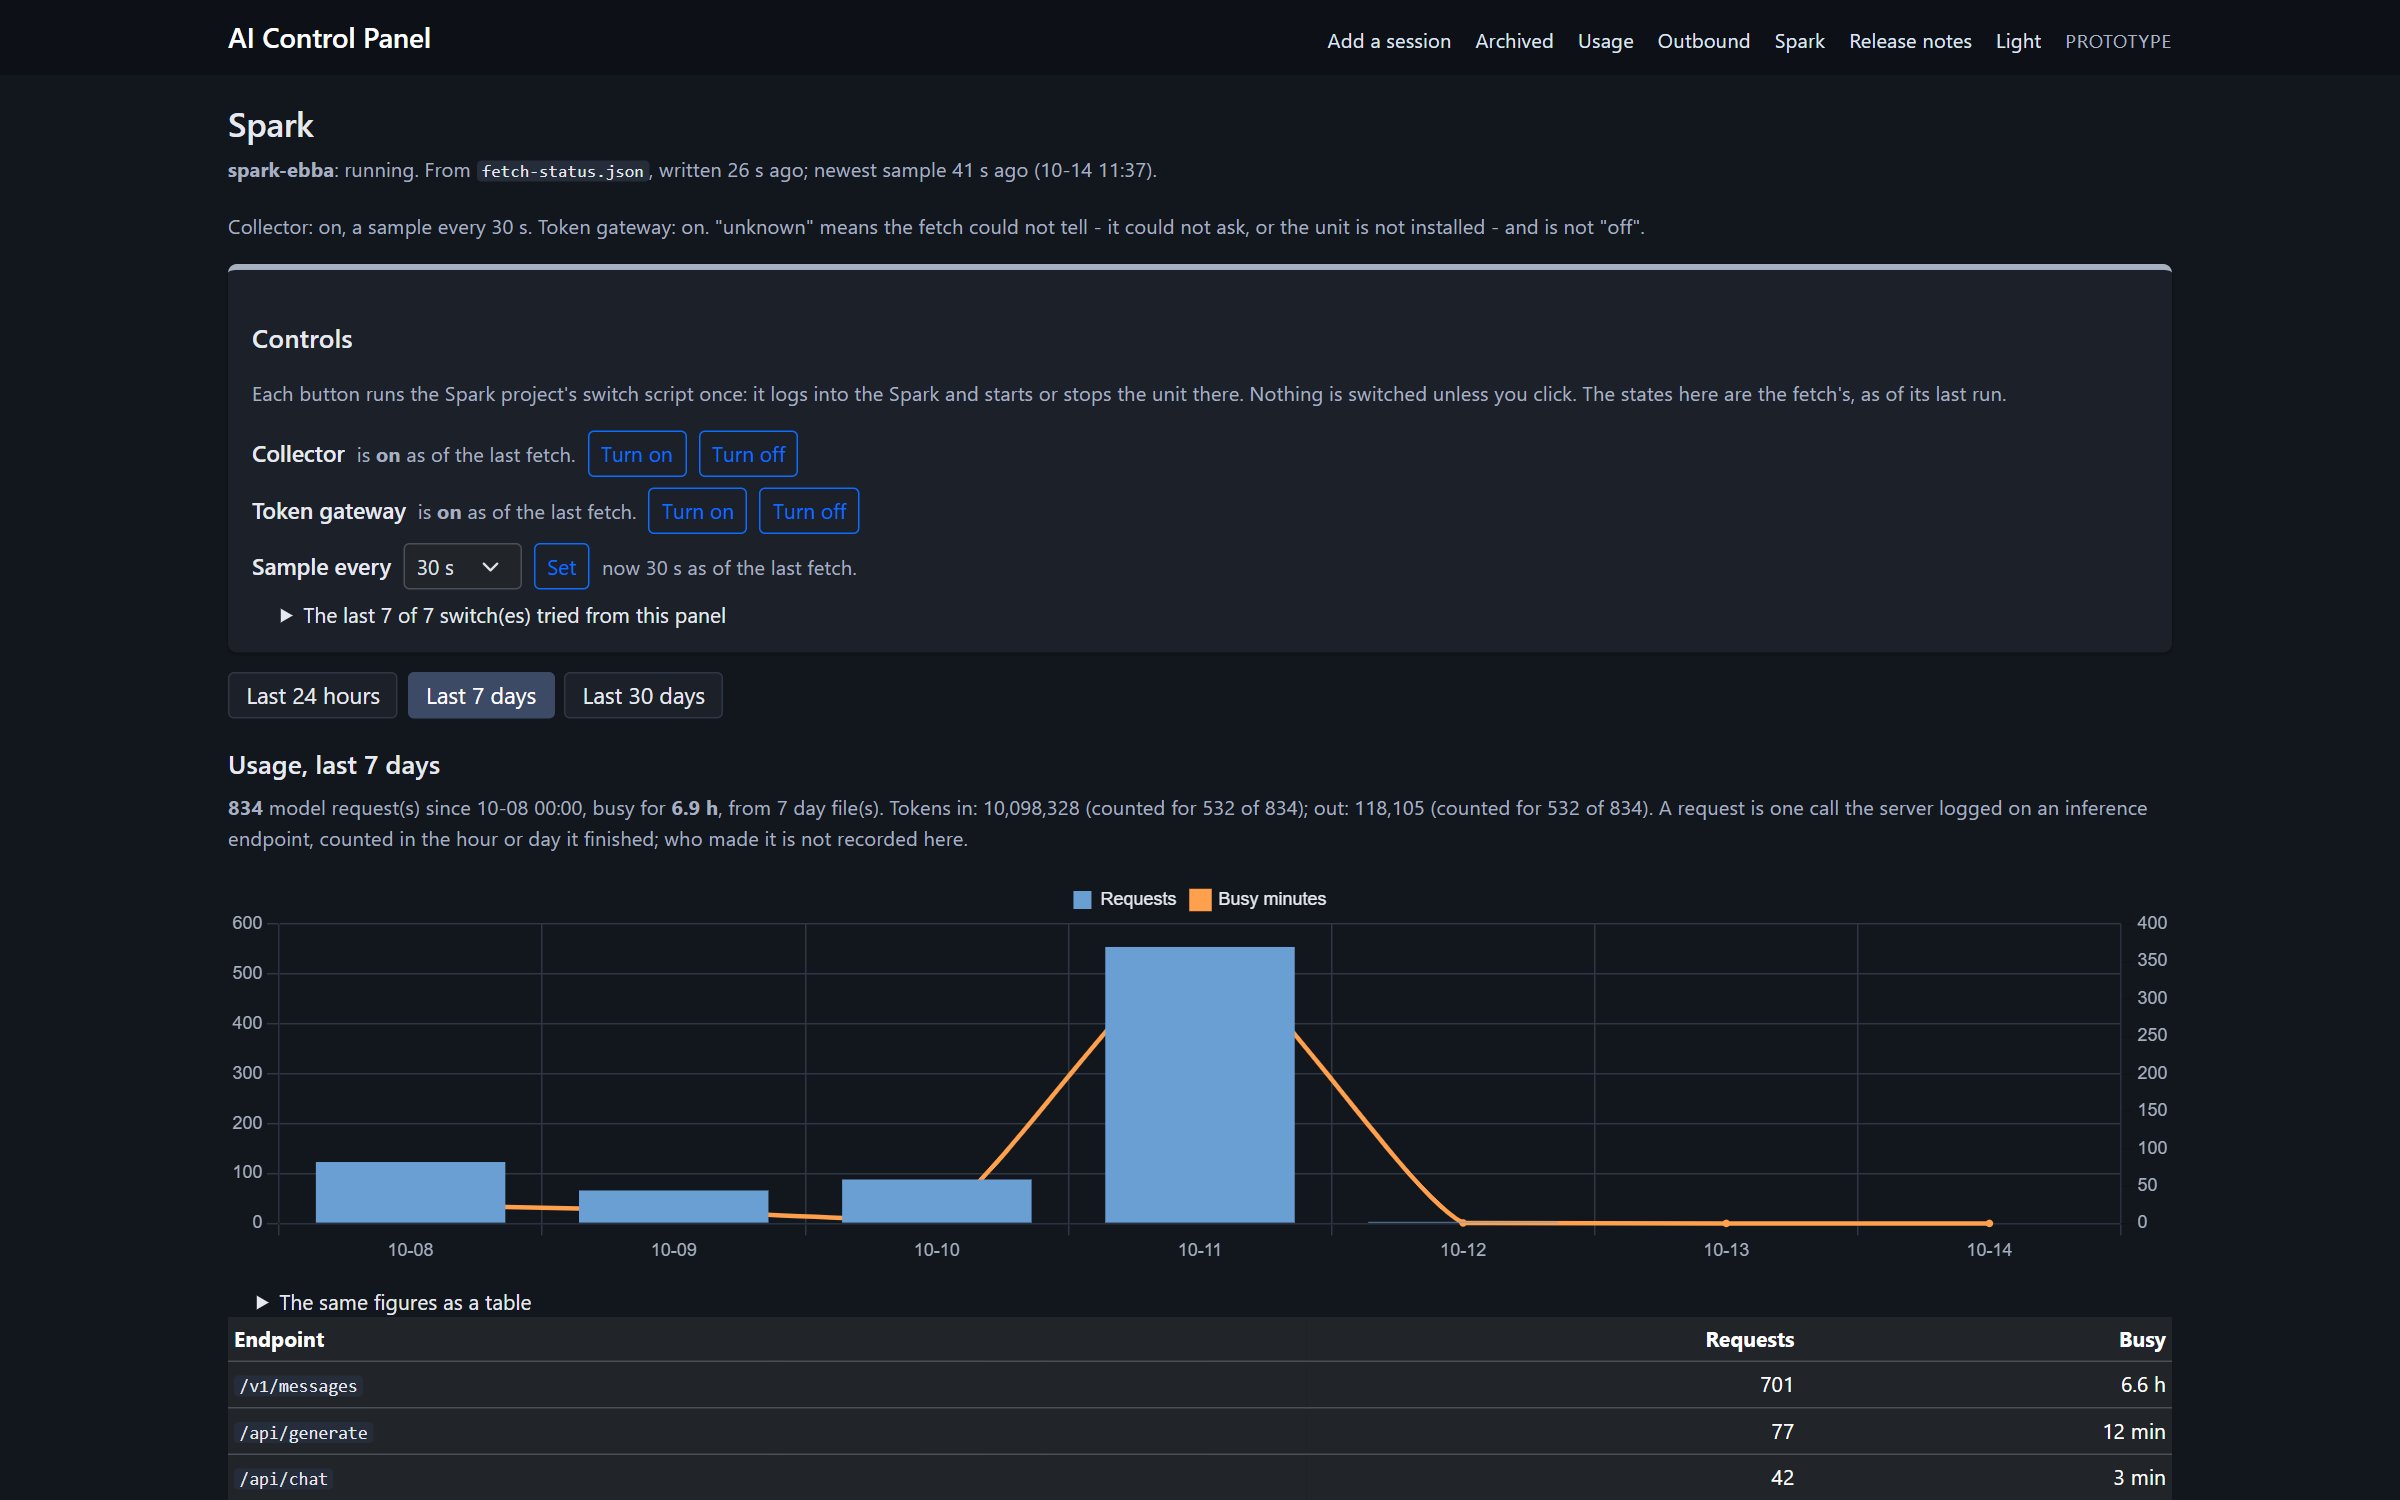
The Spark page reads what a collector on the box writes and a fetch on my PC copies down every 2 minutes. 834 model requests in the last 7 days and 6.9 hours busy. Tokens are counted for the requests that go through the gateway I run in front of the model server, and the page says how many of them that covers instead of pretending it is all of them.
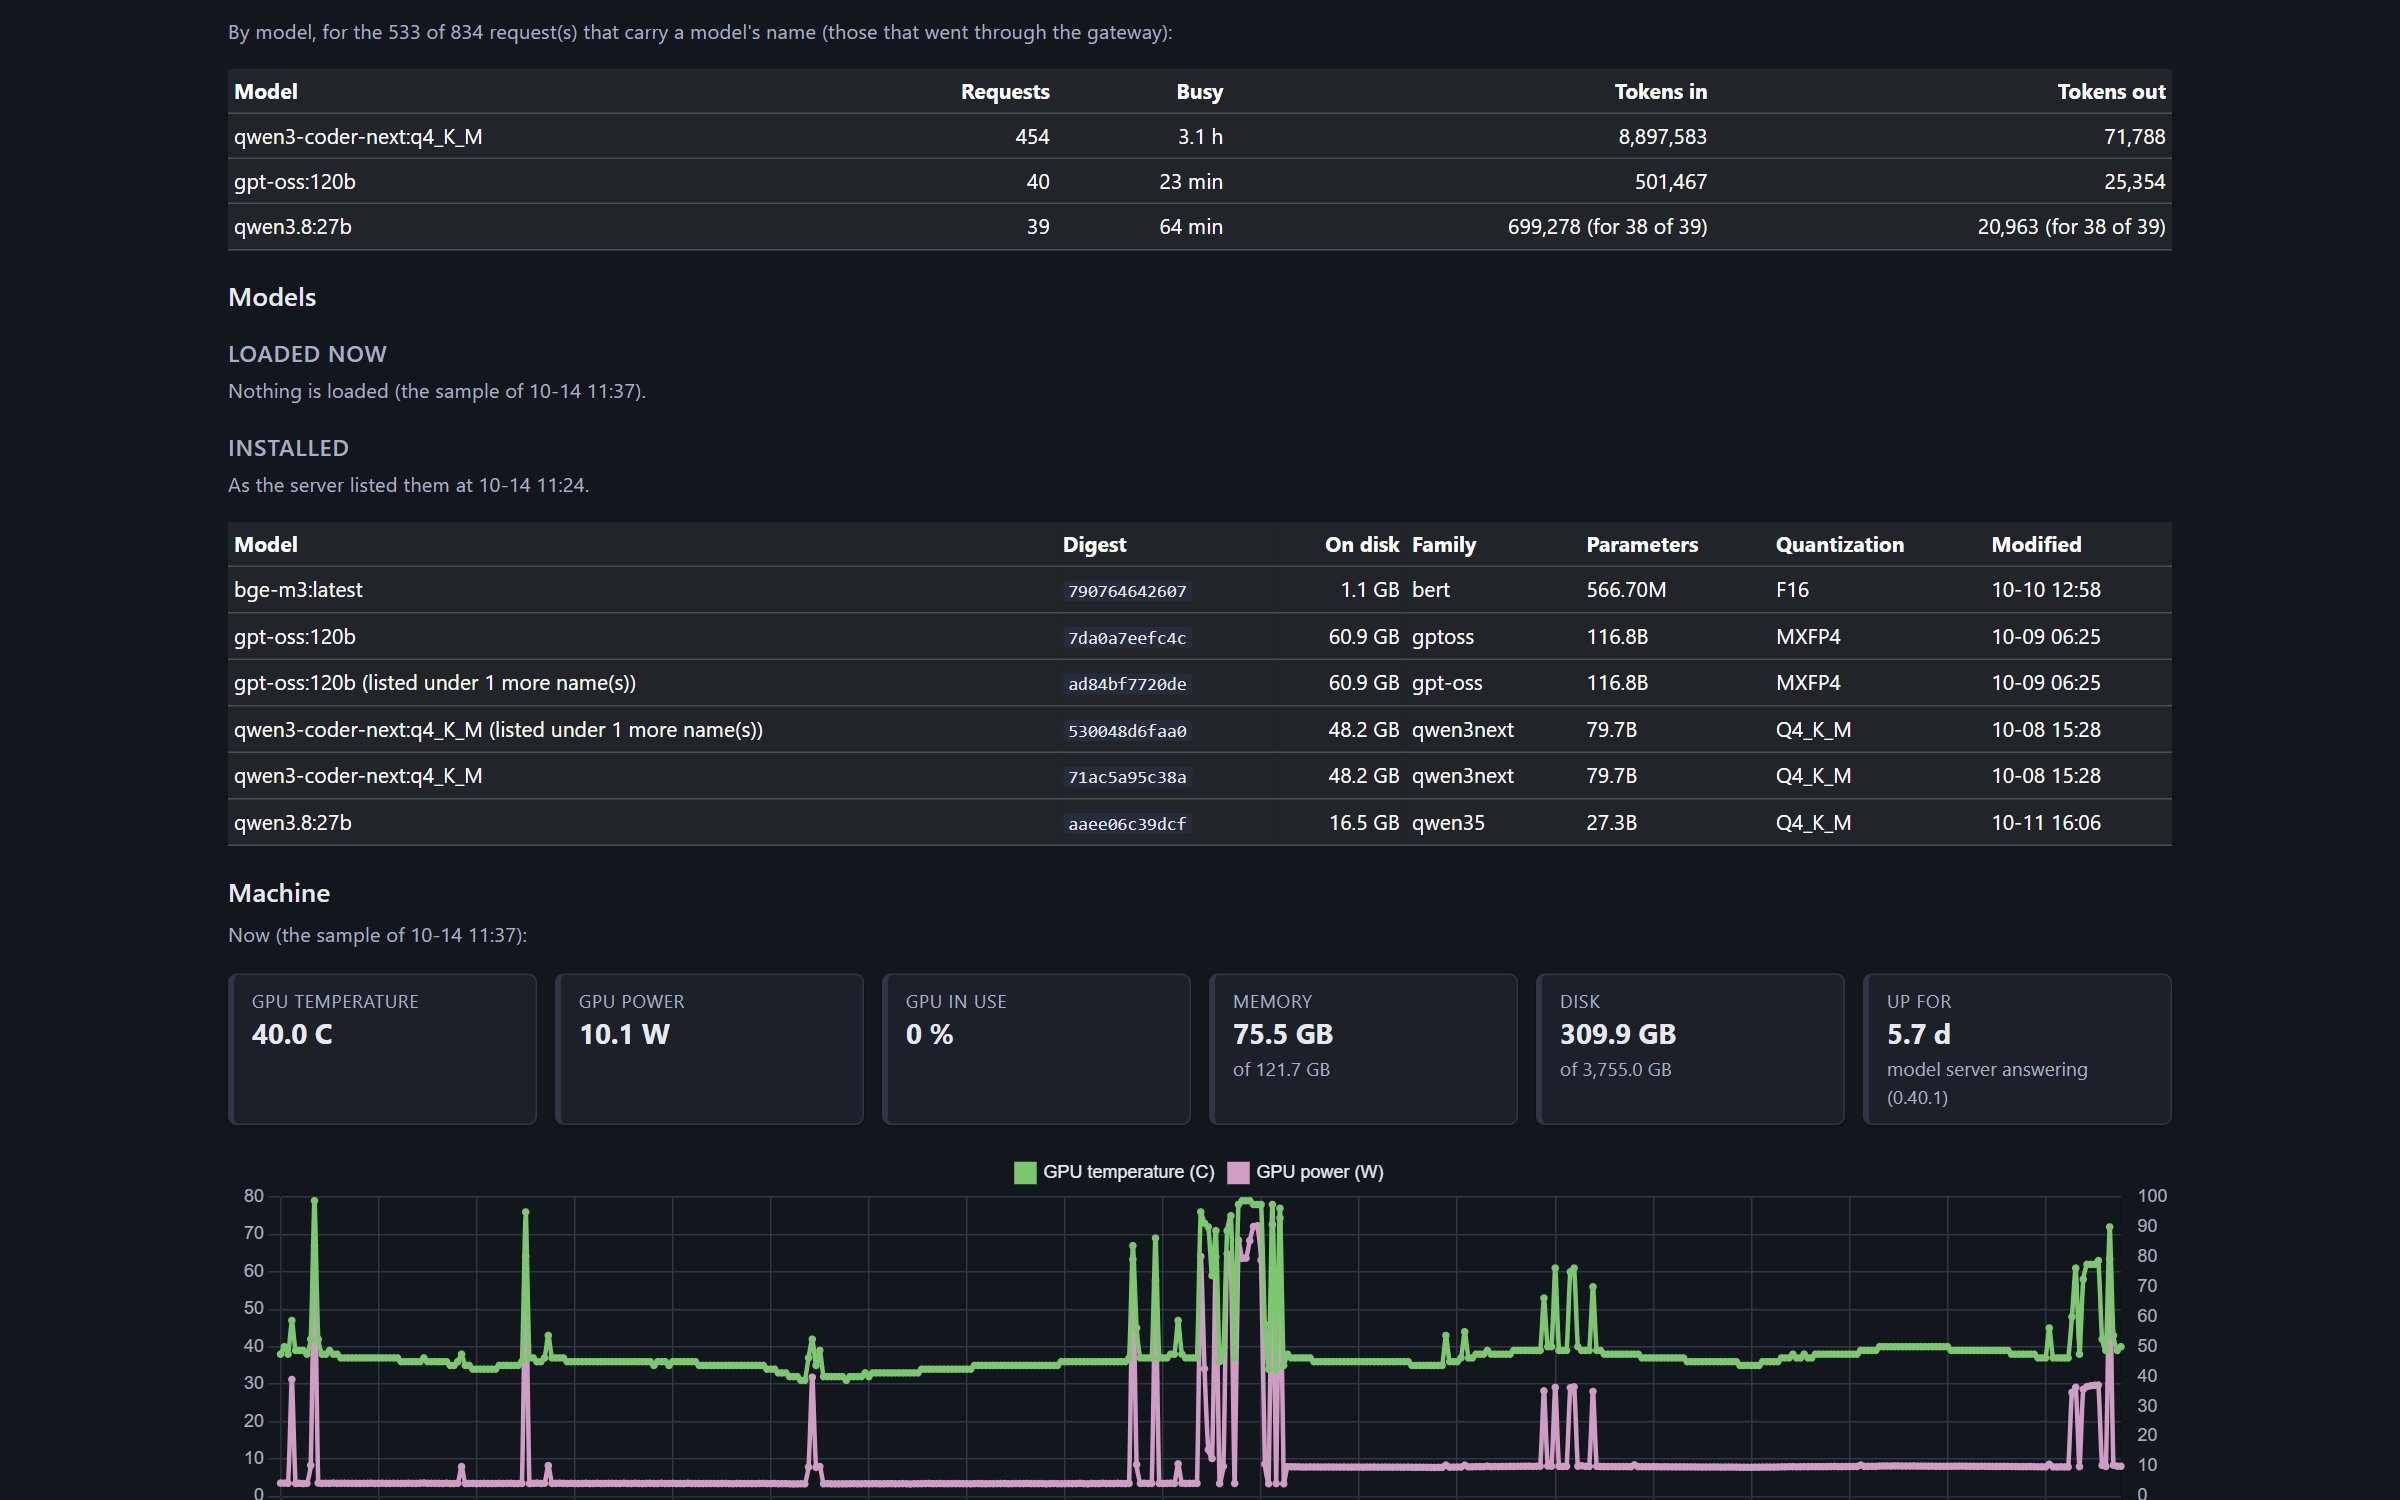
Installed models with their size and quantization. GPU temperature, power and use. 75 GB of 121.7 GB of memory in use, 5.7 days up. The controls at the top are the only thing on the page that reaches the Spark, and each one runs once when I click it.
Where the GX10 fits
The DGX Spark and the ASUS Ascent GX10 run the same NVIDIA GB10 chip. The panel reads a local model host by name, so the GX10 goes in as a second host beside the Spark.
That is the point of the whole build. The work that should stay in the office runs on hardware in the office, the panel that shows me what happened costs nothing to run, and I can still reach for a hosted model when the job calls for one.
What it is built on
The first commit was September 19. The release notes inside the panel list 57 merged pull requests since. It is .NET 10 with Razor Pages, a Python usage engine with no dependencies outside the standard library, and PowerShell for the watcher and the launch scripts. Bootstrap, Chart.js and htmx are copied into the project, so the page loads nothing from a CDN.
I built it because I run 4 AI CLIs and a local model server and I could not answer basic questions about any of them without digging through each tool's own folders.
If you are standing up local AI next to the hosted tools, ask what you will use to see both in one place, and what that tool costs to run.